2.2. Map
When to Look at This
- To see at a glance which resources make up a deployed application
- To check whether a Service is properly connected to its pods
- To see what is affected if you delete one resource
List screens are divided by resource type, which makes connections hard to see. This screen shows those connections as a diagram.
The Map Screen
Select Map in the left menu.
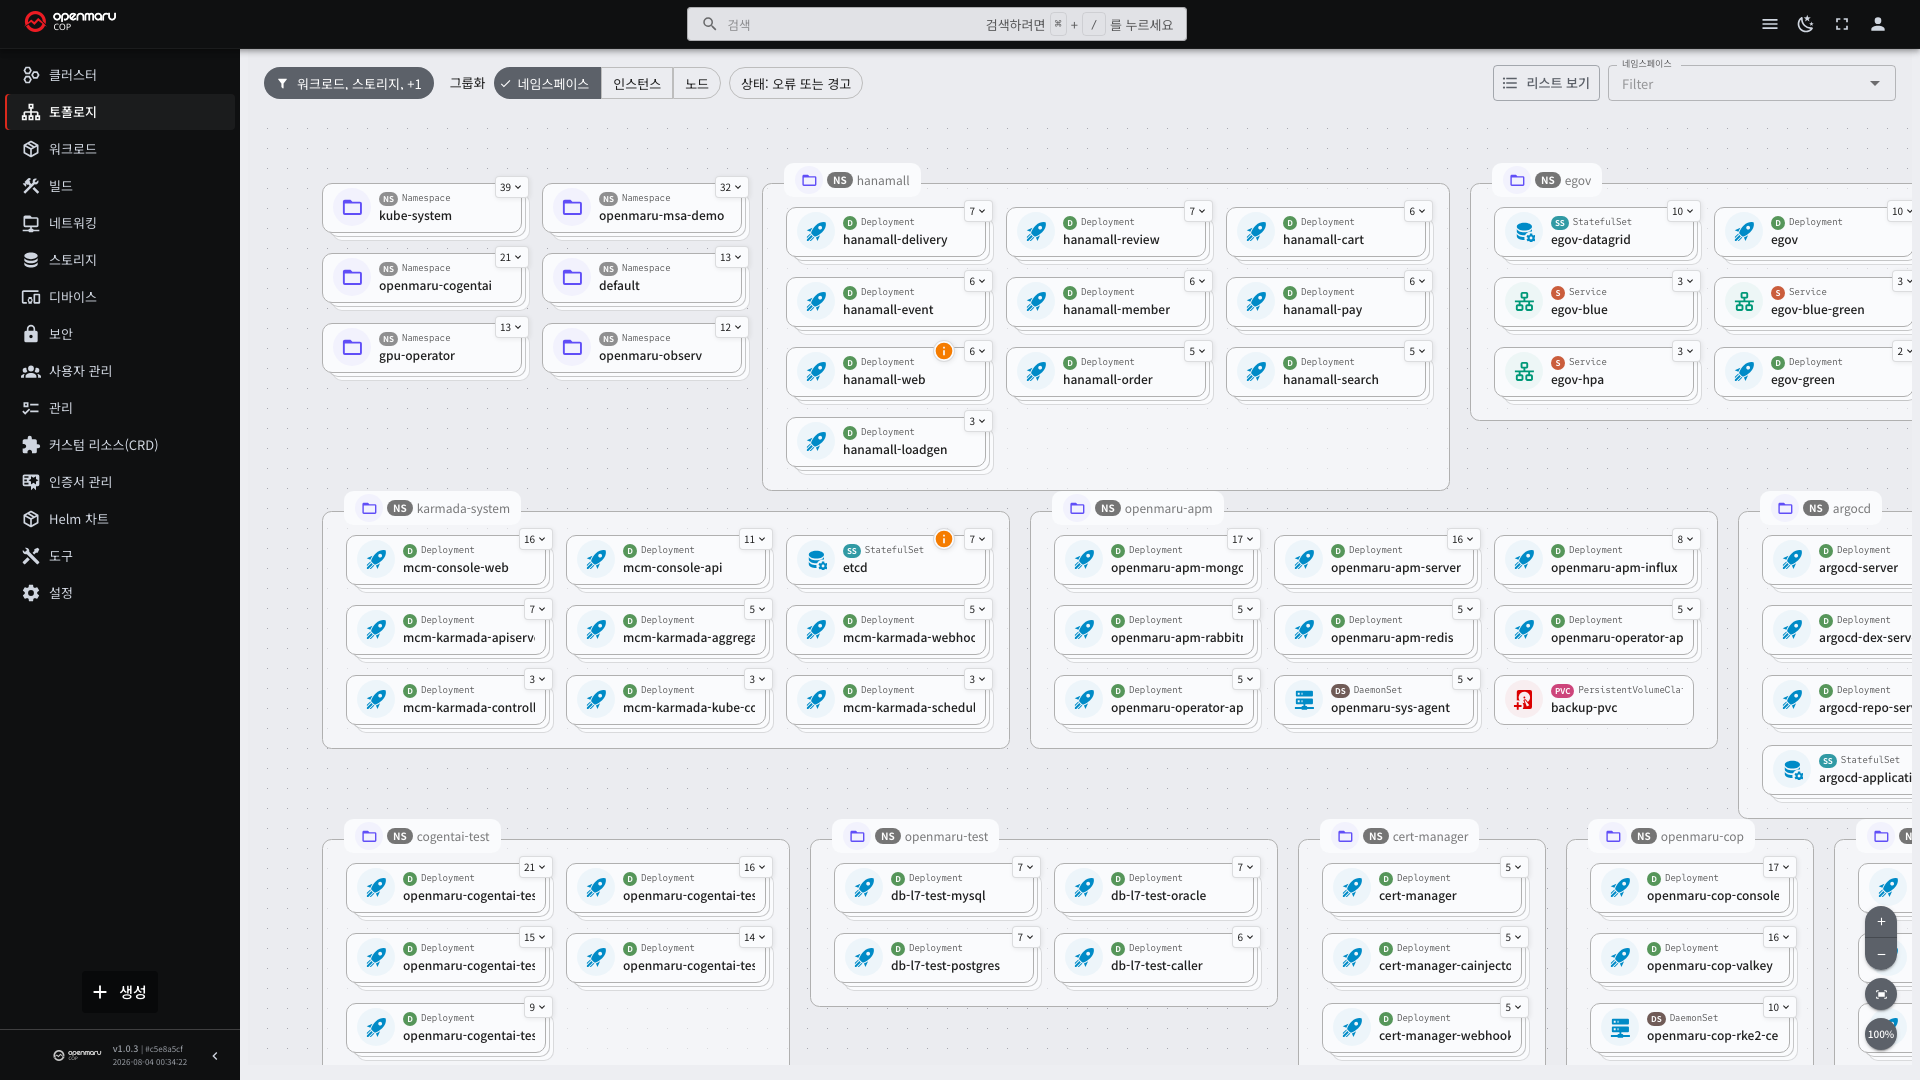
Each card is one resource, or a group of resources of the same kind. The lines between cards are the connections.
The diagram shows things that are hard to tell from lists alone.
- Which Service sends traffic to which pods
- How many pods a Deployment is running
- How far an incoming Ingress reaches
- Which pod uses which ConfigMap or Secret
Reading the Cards
| Marker | Meaning |
|---|---|
| Card title | The resource name |
| Icon on the left | The resource type |
| Number button at the top right | How many child resources this card has collapsed |
| Circular badge at the top right | How many resources have errors or warnings |
| Border color | Status. Green = normal, orange = warning, red = error |
When several resources are grouped into one, the count appears at the top right of the card. With 10 pods, one card
carries 10.
Three Interactions
Each interaction produces a different result.
| Interaction | Result |
|---|---|
| Selecting the card body | A detail drawer opens on the right |
| Selecting the number button at the top right | The grouped child resources expand |
| Selecting empty space | Clears the selection |
Selecting the body of a group card opens the detail of that group's representative resource. Selecting a Deployment card, for example, opens the Deployment detail; to see the pods inside it, expand with the number button and then select an individual pod card.
The card whose detail you last opened keeps a highlight. When moving among several resources, it shows how far you have looked. The highlight disappears when you hover another card or select empty space.
Zoom in and out with the mouse wheel over the diagram, and pan by dragging empty space.
Expanding a Single Resource
Selecting the number button on a group card leaves that one resource and expands everything attached to it. The path
Home / Namespace <name> / <resource name> appears at the top of the screen, and selecting the card body also opens
the detail on the right.
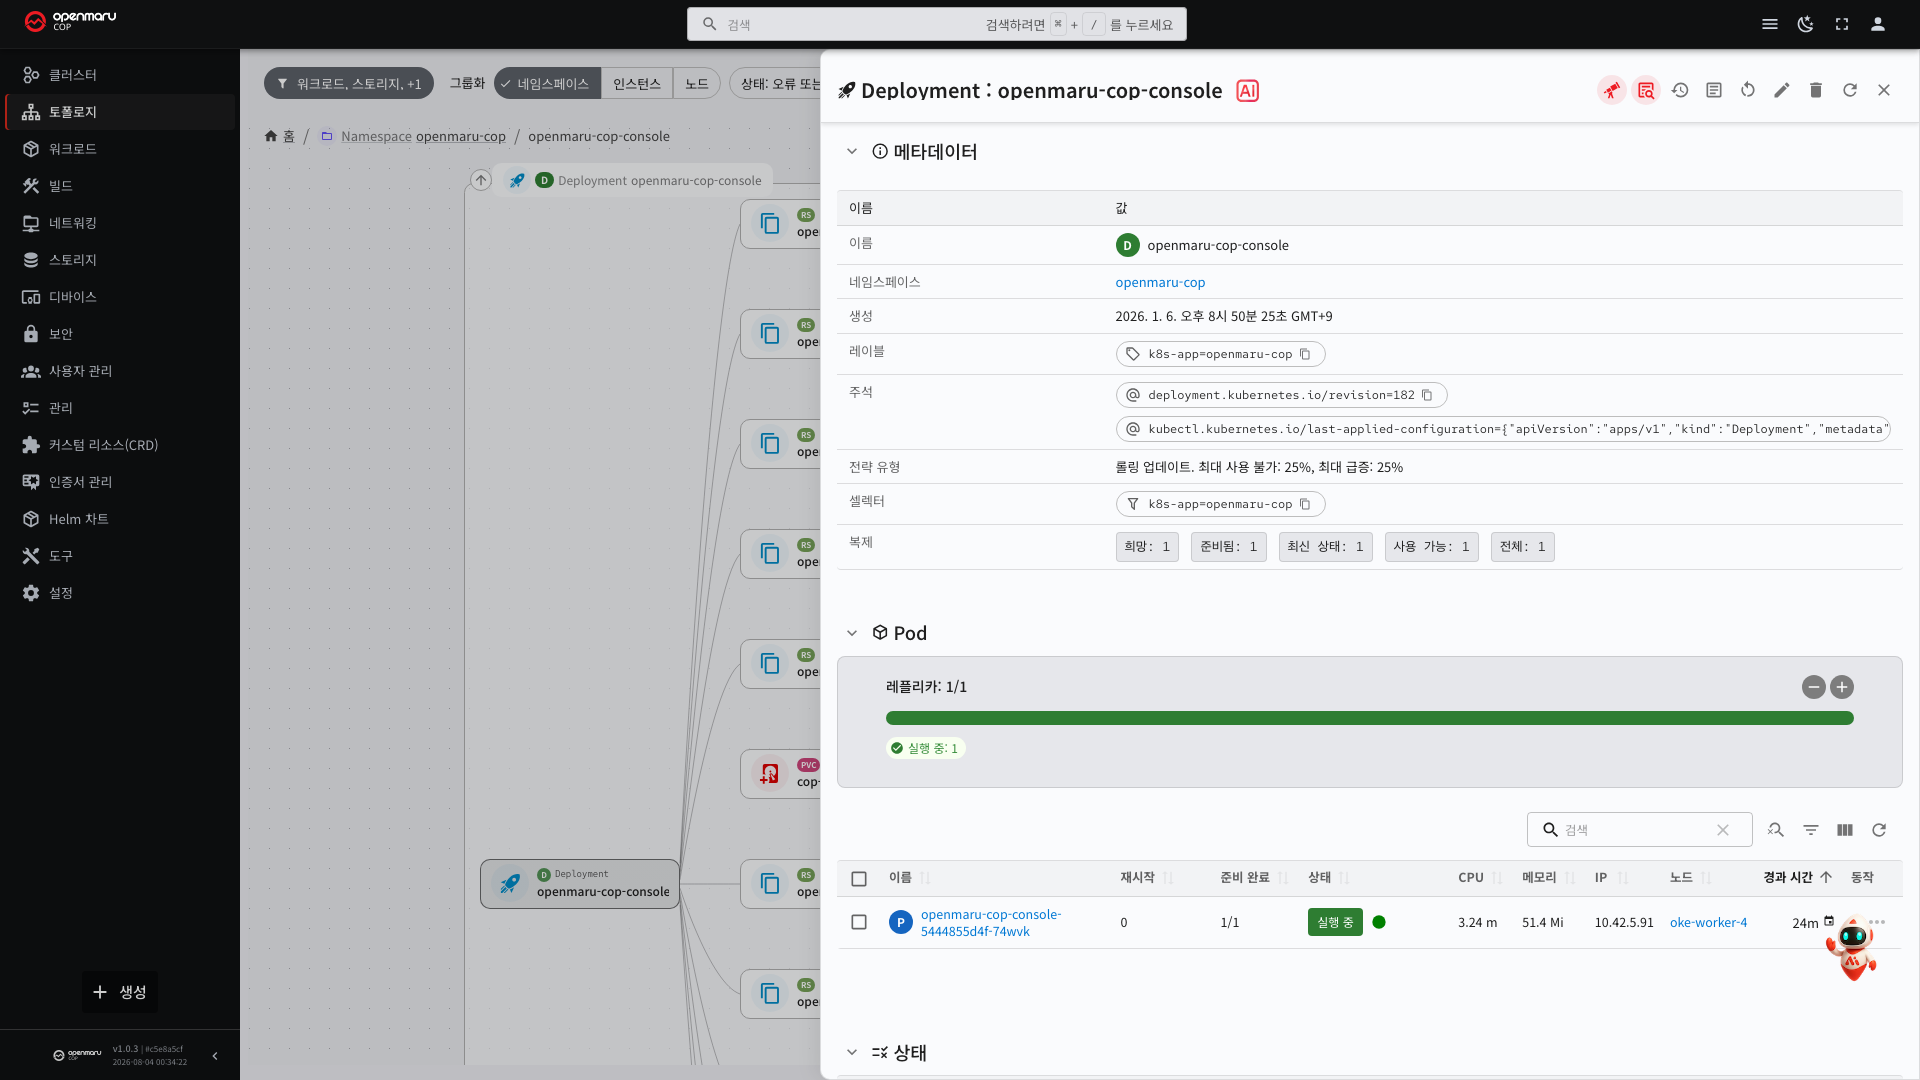
In the full diagram there are hundreds of cards, so it is hard to tell what a single resource connects to. Entering this way shows the relationships of that resource alone. The figure above expands one Deployment, and the following appear on one screen.
- As many ReplicaSets as have been created so far (one is created on each deployment; see 3.2)
- The pods currently running
- The PersistentVolumeClaim those pods use (see 6.1)
- The Service and Endpoints in front of the pods, and the Ingress in front of those (see 5.1)
In the detail on the right, you check that resource's metadata, replica count and running state, pod list, and conditions. It is the same content as the detail on the list screen, so you can also edit, restart, and delete from here.
Seeing several ReplicaSets is normal. A Deployment creates a new ReplicaSet on every deployment and leaves the previous one at zero pods. This is so it can be used for rollback (see 3.2). The ReplicaSet with lines leading to pods is the one currently operating.
Selecting the up arrow at the top left returns to the full diagram.
Narrowing the View
With many resources, the diagram becomes complicated. Narrow the scope at the top of the screen.
| Control | Description |
|---|---|
| Namespace | Shows only a particular namespace |
| Resource type | Selects which types to show — pods only, or pods and Services, and so on |
| Search | Finds by name |
Narrow by namespace first. Viewing the whole cluster at once produces hundreds of cards and the connections become unreadable.
List View
The same content can also be seen as a table. Switch to list view at the top of the screen.
Connections are easier to see in the diagram, while counts and statuses are easier to tally in the list. When you have to count failing resources, the list is more convenient.
When a Connection Is Not Shown
If there is no line from a Service to its pods, the selector does not match the pod labels. Check the selector on the Service detail and the labels on the pod detail, and compare them (see 5.1, 3.1).
If there is no line from an Ingress to a Service, either the Service name written in the Ingress rule differs from the actual one, or that Service is in a different namespace.