2.3. Cluster Diagnostics
When to Use It
- When a failure is hard to diagnose and you are contacting technical support
- When you need to capture the state of many resources at once
- When you need to secure events before they disappear
- When creating a regular inspection record
What the Diagnostics Collect
Investigating a failure means moving across several screens. You need pod status, events, logs, node resources, and component versions, and each of them lives somewhere different.
The diagnostics feature bundles these into a single file in a fixed format.
How It Differs From Collecting by Hand
| Collecting by hand | The diagnostics feature |
|---|---|
| You decide what to collect as you go | The required items are fixed, so nothing is missed |
| You run several commands in order | One button |
| Events can disappear while you collect | The state at one point in time is saved together |
| Passwords can end up included verbatim | Authentication information is masked automatically |
Events disappear after about an hour (see 2.1). Running the diagnostics right after a failure lets you see the events from that moment later on.
Running the Diagnostics
Go to Cluster > Cluster Diagnostics.
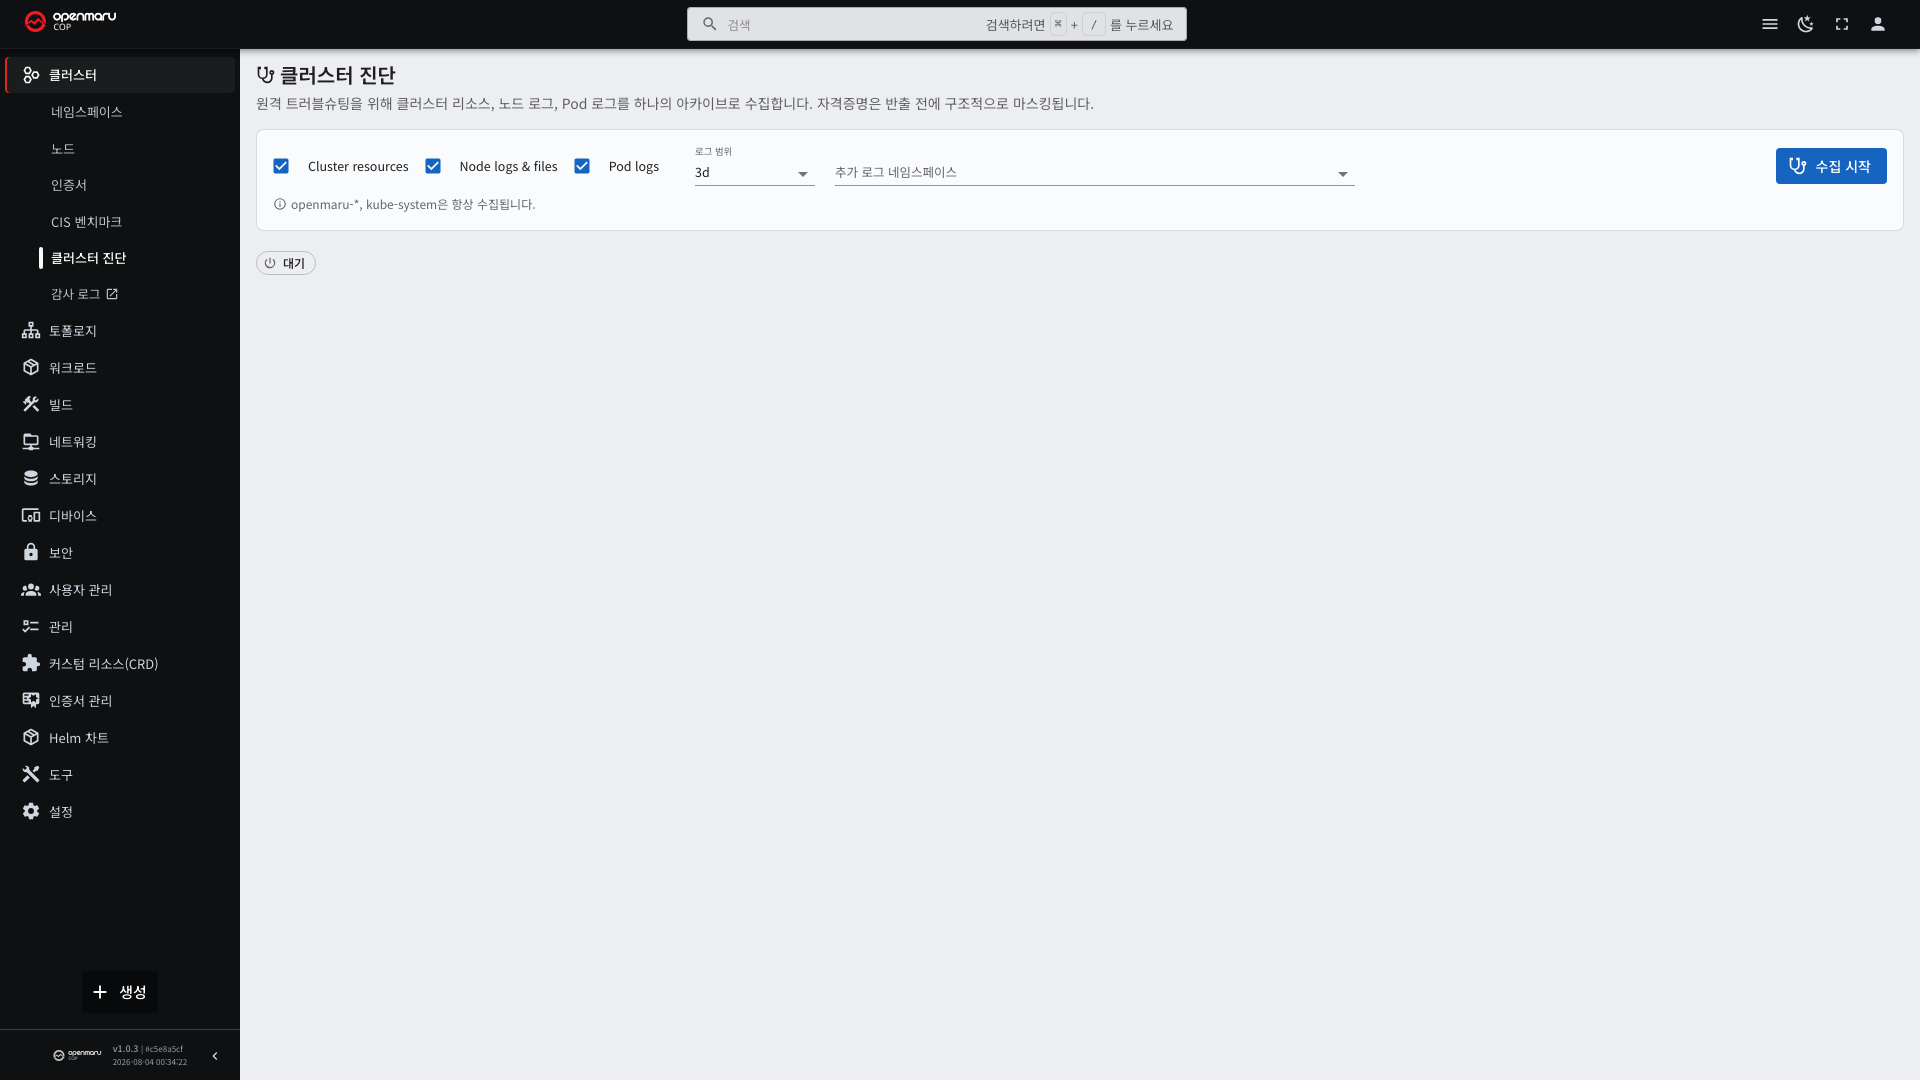
- Choose the collection scope. Specify a particular namespace or the whole cluster.
- Select Start diagnostics.
- Progress is shown on screen.
It takes a few minutes depending on the cluster size. Collection continues even if you move to another screen while the diagnostics are running.
Two diagnostics runs cannot be active at the same time. Start again after the first run finishes.
If the problem is confined to a particular namespace, narrow the scope. Collecting the whole cluster produces a large file and takes a long time.
Downloading the Result
When collection finishes, a Download button appears. The result is saved as a compressed file.
File Layout
Extracting the downloaded archive gives the following structure.
| Path | Contents |
|---|---|
version | Product, Console, Kubernetes, and per-node versions, plus the collection time. In a format meant to be read directly |
manifest.json | All collection information. Run number, cluster name, collection time, collection scope, namespaces targeted for logs, log period, version information, per-node collection success and failure, whether masking was applied and the rule version, and warnings raised during collection |
cluster/ | Resource lists — nodes.json, namespaces.json, pods.json, events.json, services.json, deployments.json, daemonsets.json |
logs/<namespace>/<pod>.log | Container logs for the specified scope |
nodes/<node name>/ | Material collected directly from the node — system log (journal), uname, ip a, df -h, container list (crictl ps), Kubernetes version and certificate expiry check results, sysctl, lscpu, free, vmstat, time synchronization status |
The version information is already inside the archive. The product version, Console version, Kubernetes version,
and per-node versions are recorded in version and manifest.json, so when sending it to technical support you only
need to send the one downloaded .tar.gz file. You do not have to look up and write down the versions separately.
Even if some items cannot be retrieved during collection, the collection itself does not stop. Items that could not
be retrieved are recorded in the warning list in manifest.json and in the per-node success and failure record, so
whoever receives the material can tell what is missing.
Handling the Material With Care
The collected material contains environment information. Passwords and authentication information are masked automatically, but check the contents before sending it outside.
Some things may not be masked.
- Values written into application logs (personal information, connection strings)
- Settings placed in a ConfigMap in plain text
- Values written directly into environment variables
The fundamental remedy is to keep sensitive values out of logs. Manage values that must be hidden as Secrets (see 3.4).