8.2. Runtime security
Viewing the process exec, exit and policy events that Tetragon records, and checking blocked actions.
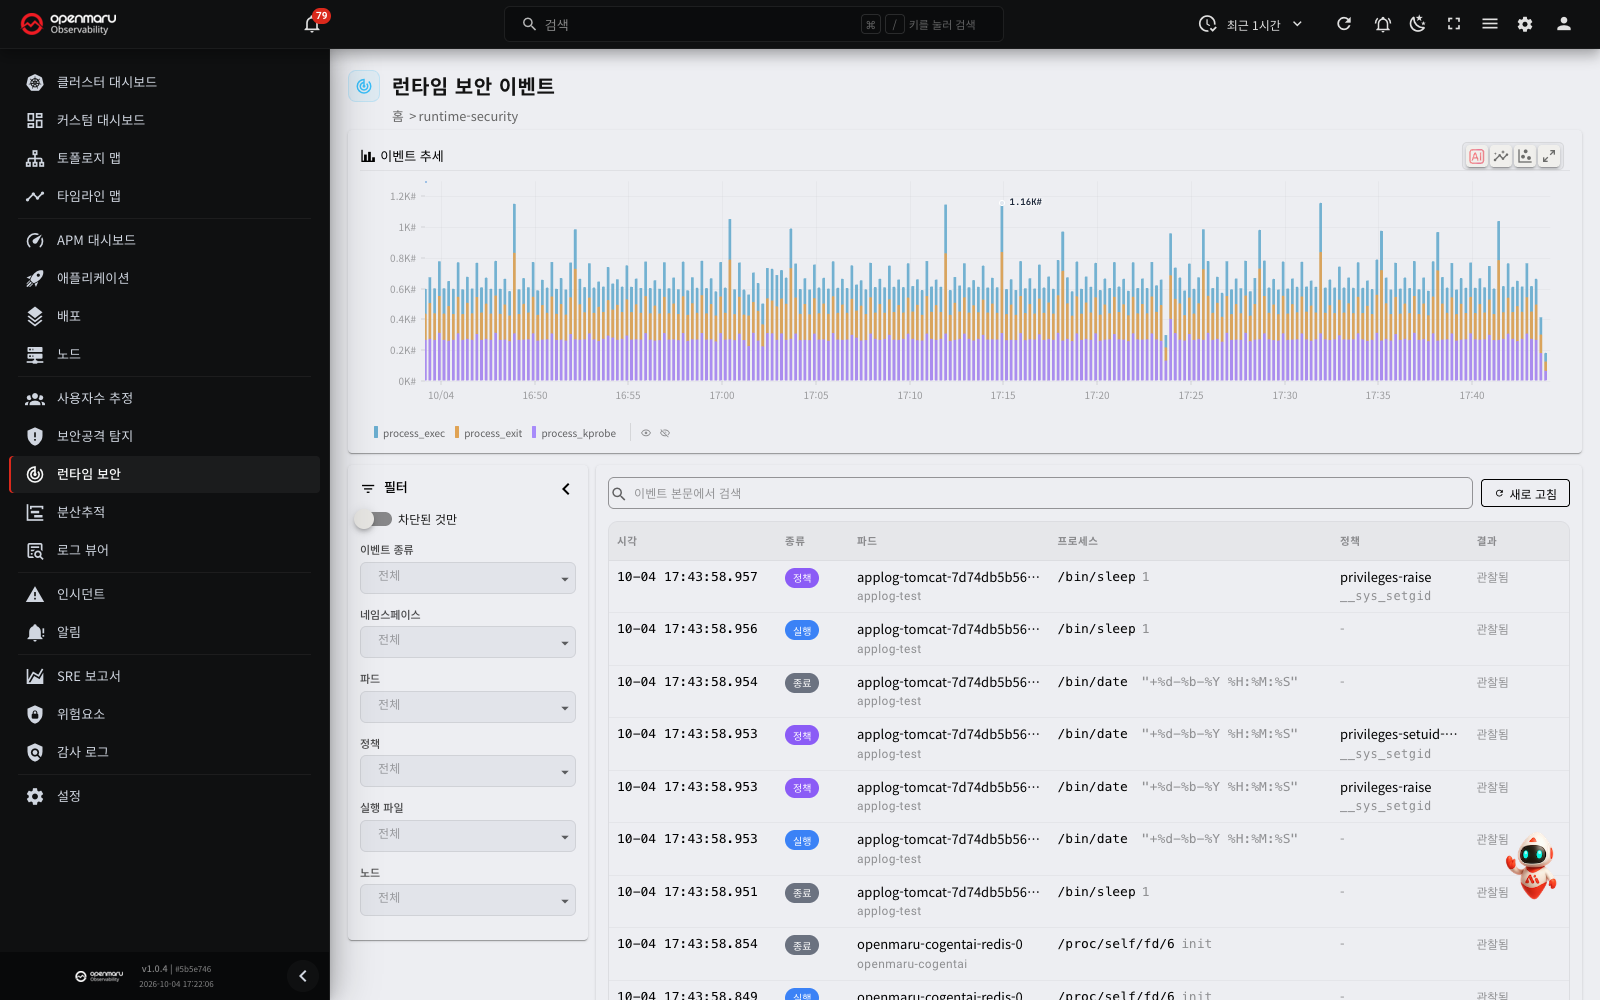
Overview
The Runtime Security screen shows the events of processes that run inside the containers of a Kubernetes cluster. You can see which process ran in which pod, which policy it matched, and whether the action was blocked.
Tetragon makes these events. Tetragon is an open-source runtime security tool. It uses eBPF to observe process execution and system calls in the kernel. It records the actions that match a policy (TracingPolicy). If the policy specifies a block, Tetragon stops the action by killing the process.
This screen only shows events. To create or change a policy, use COP Console.
Open it from the Runtime Security menu in the left sidebar. The menu is directly below the Attack Detection menu.
Note: The Runtime Security menu shows only when both of these conditions are true.
- The monitored environment is a Kubernetes cluster. In a host (non-Kubernetes) environment, the menu is hidden.
- A DaemonSet named
tetragonruns in the cluster. Without Tetragon, this screen has no events to show, so the menu is hidden.Right after login, the menu can show for a moment and then disappear. This occurs because the screen has not read the status information yet.
Event kinds
This screen shows three kinds of Tetragon events. The table and the details window show a short name. The filters, the legend of the event trends chart and the raw event show the original name.
| Table label | Original name | Description |
|---|---|---|
| exec | process_exec | A process started in a container. |
| exit | process_exit | A process ended. |
| policy | process_kprobe | A process called a kernel function that a policy (TracingPolicy) specifies. If the policy is set to block, the event also records the block result. |
Screen layout
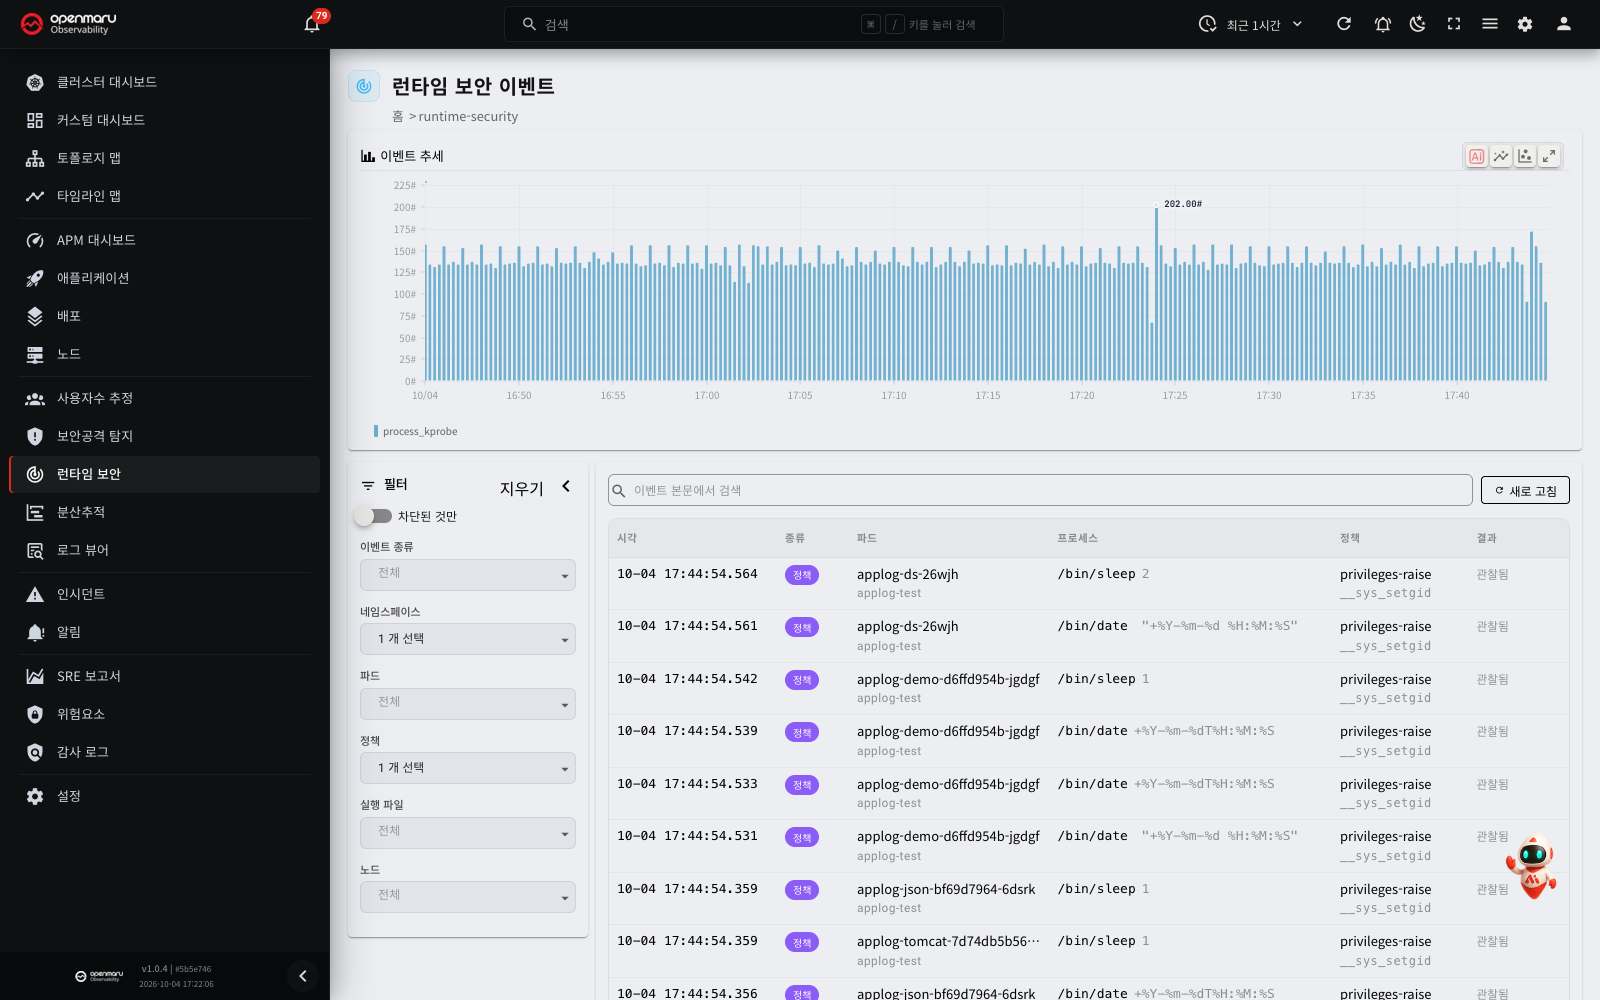
From top to bottom, the screen has the event trends chart, the filter panel and event table, and the event details.
| Area | Description |
|---|---|
| Event trends | Shows the number of matching events in the selected time range as bars, per time slot and per kind. If there are no events, "No events in this time range" shows. |
| Filters (left) | Sets the conditions for the events to show. It has the Blocked only switch and a selection list for each field. |
| Event table (right) | Shows the matching events, newest first. Above it are the Search in event body field and the Refresh button. |
| Details | A window that opens when you click a table row. It shows the process ancestry, the detail fields and the raw event. |
Event trends
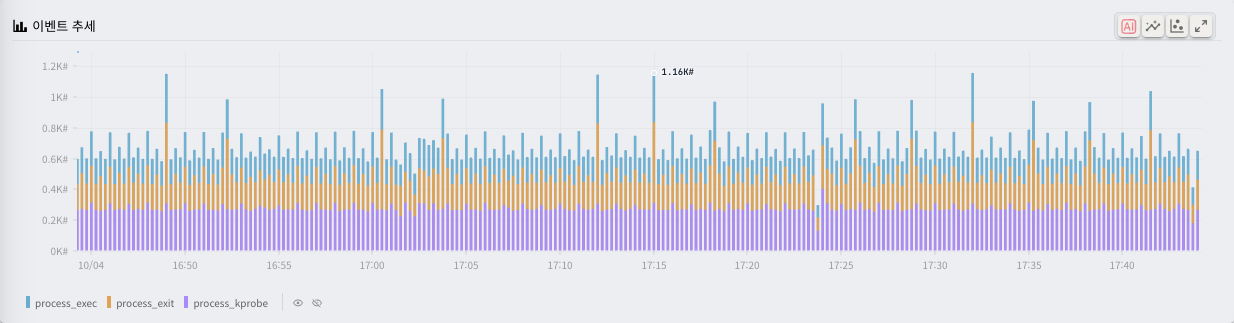
The chart shows the number of events as bars per time slot, split by kind. Use it to find the time slots where the number of events suddenly goes up or down. To select a period on the chart, see Selecting a period.
Filter panel
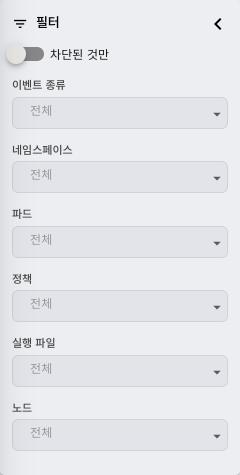
| Item | Description |
|---|---|
| Blocked only | When on, shows only the events that a policy blocked. |
| Event kind | Select from process_exec, process_exit and process_kprobe. |
| Namespace | The namespace of the pod where the event occurred |
| Pod | The pod where the event occurred |
| Policy | The name of the policy (TracingPolicy) that made the event |
| Binary | The path of the process executable (for example, /usr/bin/head) |
| Node | The node where the event occurred |
You can select more than one value in each list. When you select values, the list shows the count, for example "2 selected". If you select nothing, the list shows All.
Event table
| Column | Description |
|---|---|
| Time | The time the event occurred, in the format month-day hour:minute:second.millisecond. This is the time the event occurred, not the time it was collected. |
| Kind | The event kind. exec, exit and policy show as colored chips. |
| Pod | The pod name. The line below shows the namespace. |
| Process | The executable path and arguments. Long values are cut at one line. See the full arguments in the details. |
| Policy | The policy name. The line below shows the kernel function that the policy watched (the hook point). Events not related to a policy show -. |
| Result | Events that were not blocked show Observed. Blocked events show the block action (for example, Sigkill) in a red chip. If the event has no block action, the chip shows Blocked. |
A blocked event's row has a red line on its left side. This lets you find blocked events in the list quickly.
Event details
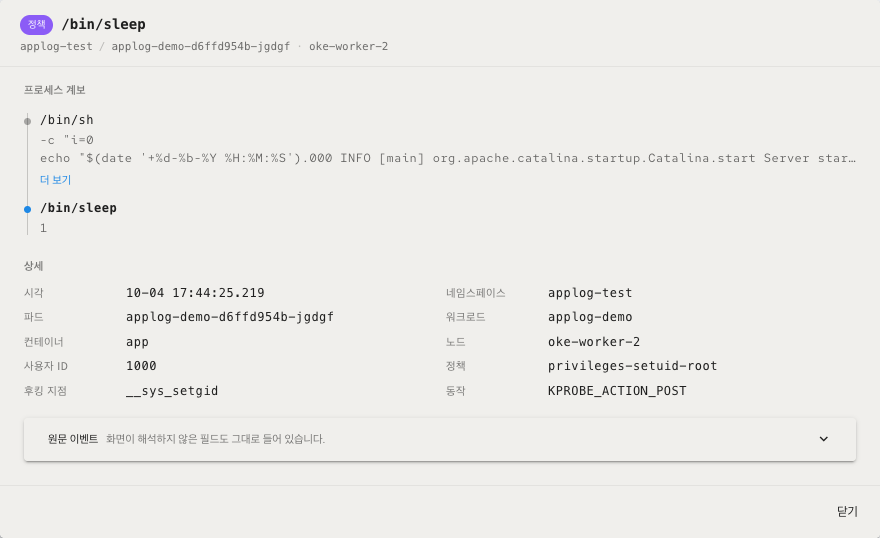
Click a row in the table to open the details window. The window shows the information in this order.
- Header: shows the event kind, the executable path and the block action (blocked events only). The line below shows
namespace / pod · node. - Blocked by: shows only for blocked events. It shows the name of the policy that blocked the action and the hook point.
- Process ancestry: shows the parent process above the process of this event.
- Details: shows the time, namespace, pod, workload, container, node and user ID. For events of the policy kind, it also shows the policy, hook point and action.
- Raw event: the original event JSON that Tetragon sent. It is collapsed by default.
Click Close to close the details window.
Main features
Selecting a period
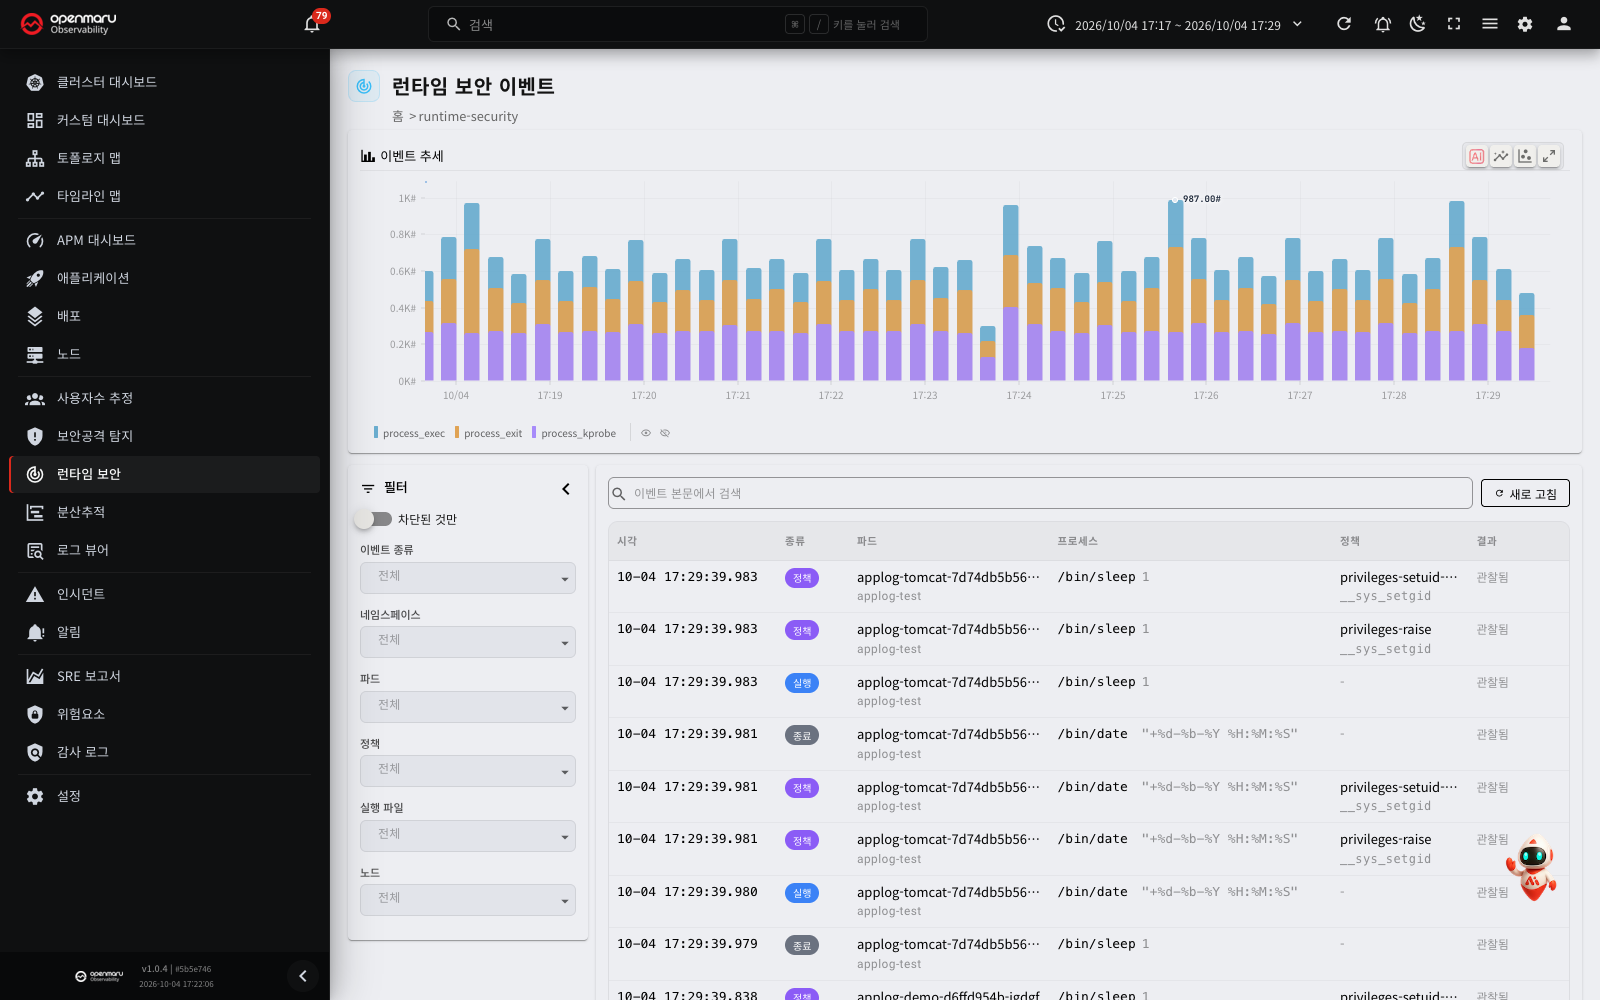
You can select a period on the event trends chart and show only the events in that period.
- Drag: drag horizontally on the chart to show the period you dragged.
- Click a bar: click a bar to show the period of that bar.
When you select a period, the time picker at the top changes to the same period. The event table and the filter lists load again for that period.
Note: If the period of the bar you click is 60 seconds or less, the screen shows a 5-minute period with that bar at the center. A bar wider than 60 seconds shows its own period.
Note: If the chart shows a Forecast or Anomaly Detection result, period selection does not work. A drag only zooms in on the chart, and a click on a bar does not change the time range. To select a period, clear the forecast and anomaly detection results.
To go back to the previous time range, select the time range again in the time picker at the top.
Filters and search
- Select values in the lists of the filter panel on the left. The screen loads again immediately.
- Type words in the Search in event body field above the event table, and press Enter. Only the events whose raw text contains the words show.
- To remove all filter conditions, click the Clear button at the top right of the filter panel.
Note: The search finds whole words. The raw text must contain all the words that you type. If you type only part of a word, the search does not find it. For example,
shaddoes not find events that contain/etc/shadow.
The Clear button shows only when at least one condition is set. The button removes only the conditions in the filter panel. The search text stays.
The lists show only the values that exist in the current time range. When you change the time range, the lists load again.
Each list shows only the 500 values with the most events, sorted by name. If the value you look for is not in the list, make the time range shorter.
Click the Hide filters button (<) at the top right of the filter panel to collapse the panel and make the table wider. Click the collapsed bar to open the panel again. If conditions are set when you collapse the panel, the border color of the collapsed bar changes.
If no events match, "No events match these filters." shows in place of the table.
Checking blocked events
To see first the actions that a policy blocked, do these steps.
- Turn on the Blocked only switch at the top of the filter panel.
- In the table, read the block action in the Result column and the policy name in the Policy column.
- Click a row to open the details window.
- In the Blocked by line, read the policy that blocked the action and the hook point.
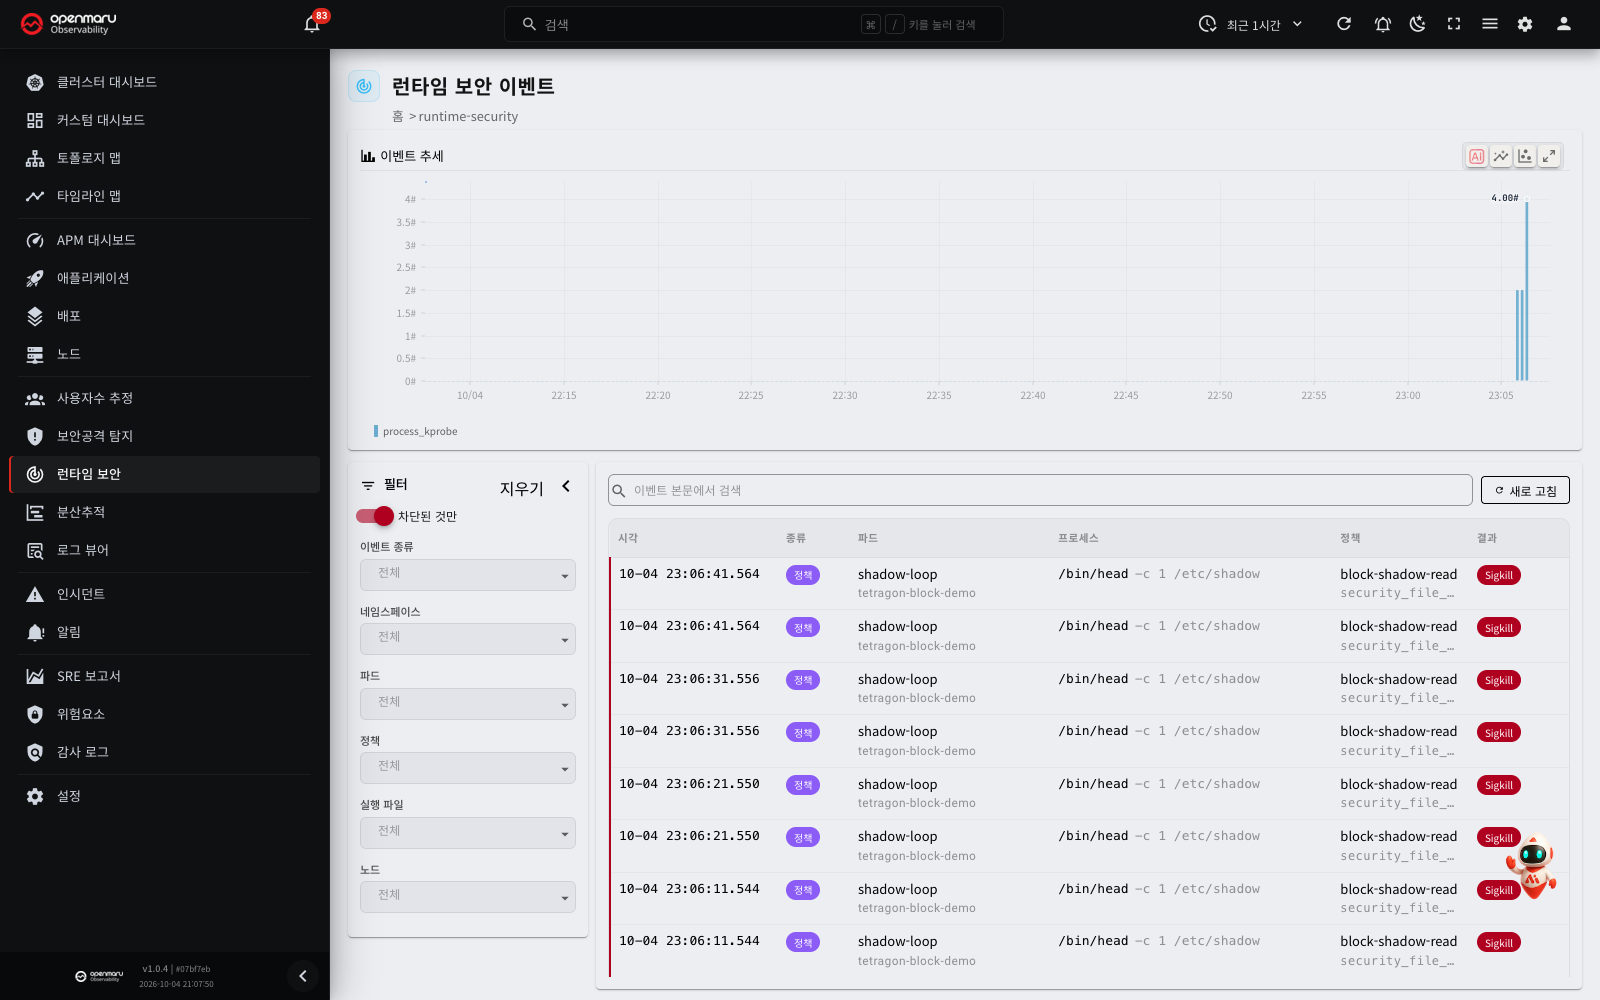
When the Blocked only switch is off, the red line on the left of the row still marks blocked events.
Checking the process ancestry
When you investigate an event, the first question is "which process started this process?". The Process ancestry in the details window answers it.
- The upper line is the parent process. The lower line is the process of this event.
- Each line shows the executable path and the arguments.
- Long arguments show only two lines. Click Show more to show all the arguments. Click Show less to go back to two lines.
- If the event has no parent process information, "The parent process is not recorded in this event." shows.
For example, if a shell loop tried to read /etc/shadow and was blocked, the ancestry shows as follows.
/bin/sh -c "while true; do head -c 1 /etc/shadow >/dev/null 2>&1; sleep 2; done"
/usr/bin/head -c 1 /etc/shadow
Checking the raw event
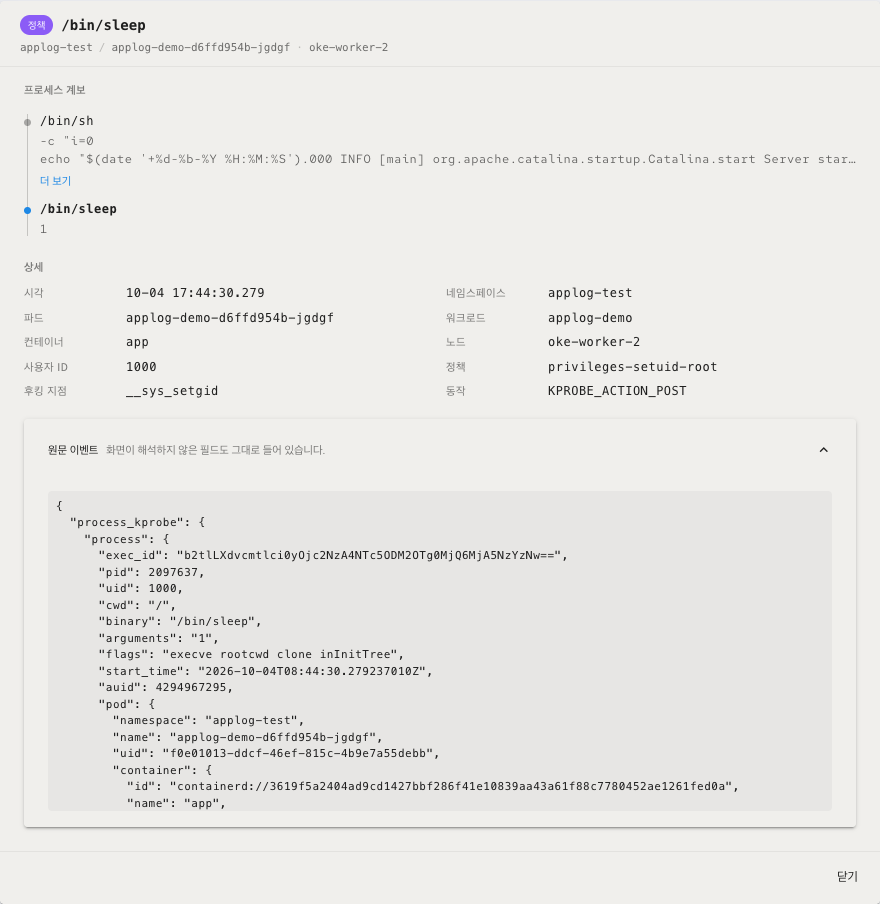
Click Raw event at the bottom of the details window to open the original event JSON that Tetragon sent. The table and the detail fields show only some of the fields. The raw event also contains the fields that the screen does not interpret. If you need information that the detail fields do not show, read the raw event.
Display limit
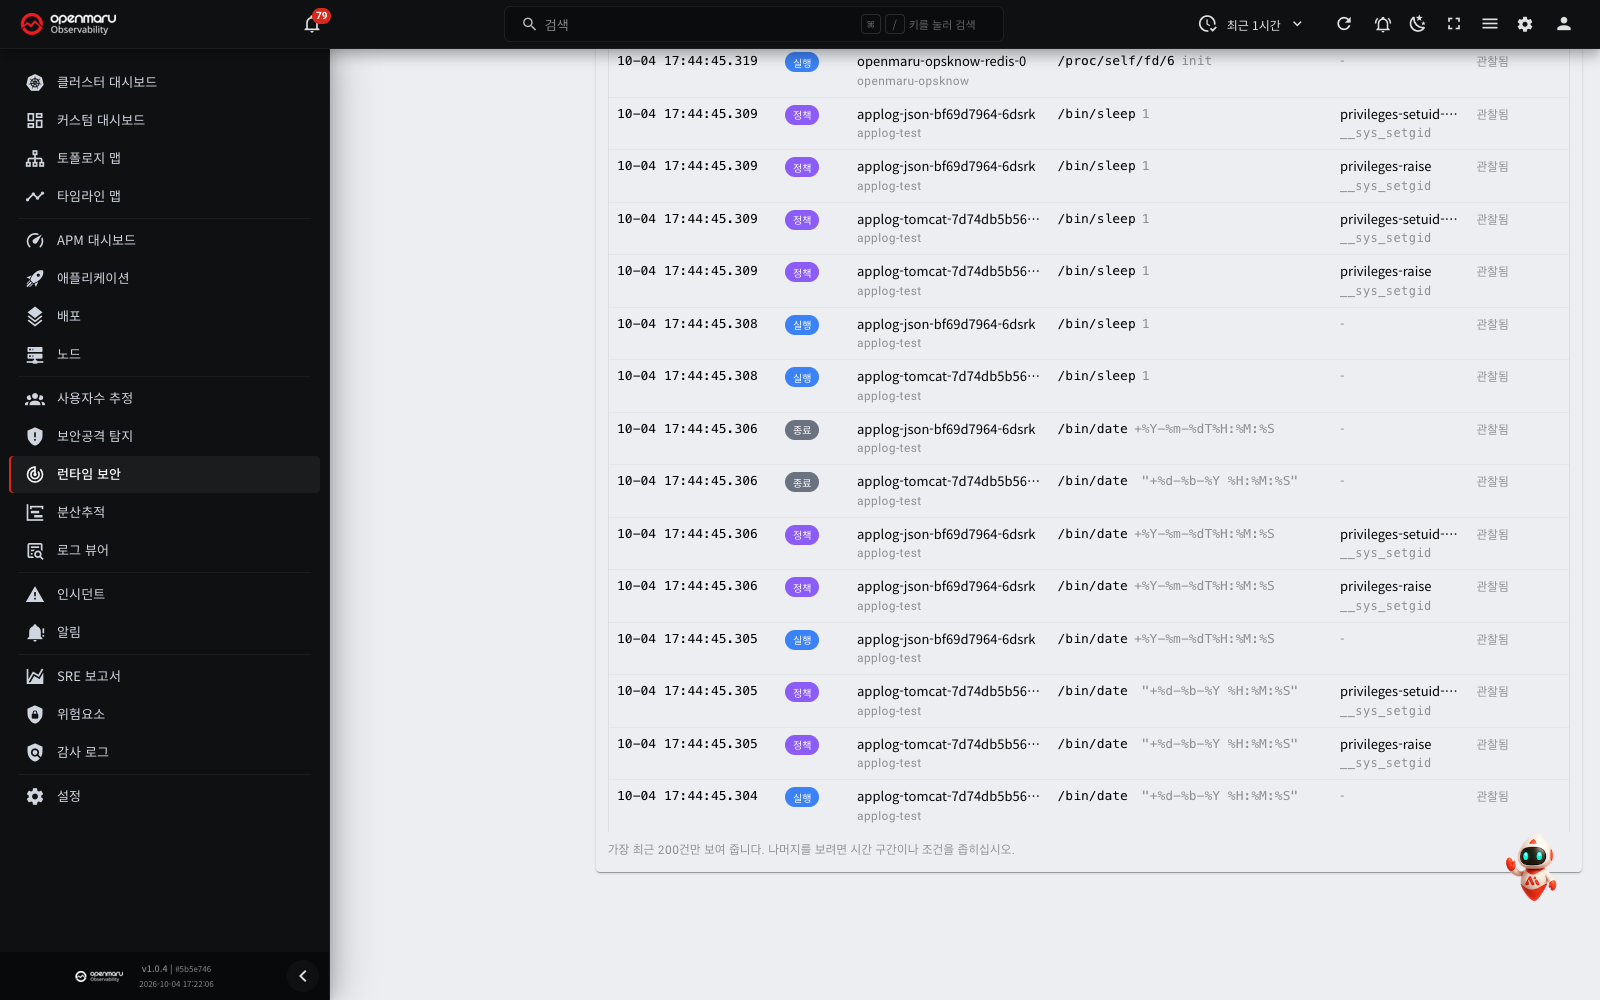
The event table shows only the 200 most recent matching events. When the table has 200 events, this message shows below the table.
Showing the most recent 200 events. Narrow the time range or filters to see the rest.
To see events older than these 200, use one of these methods.
- Drag the period you want on the event trends chart, or click a bar.
- Add conditions such as namespace, pod or policy in the filter panel.
- Use Search in event body to specify words in the raw text.
The event trends chart is not affected by the 200-event limit. It shows the number of all matching events in the time range. The filter and search conditions also apply to the chart.
Opening the screen with conditions from COP Console
When you move from the policy screen of COP Console to the Runtime Security screen, COP Console puts conditions in the address. The screen opens with these conditions selected in the filters. For example, you can go directly to the events that a specific policy made.
You can also put the conditions in the address yourself.
/p/<project ID>/runtime-security?policy=block-shadow-read&enforced=true
| Address condition | Selected filter | Example value |
|---|---|---|
policy | Policy | block-shadow-read |
namespace | Namespace | default |
pod | Pod | a pod name |
kind | Event kind | process_kprobe |
enforced | Blocked only | true |
After the screen opens, you can change the conditions in the filter panel or remove them with Clear.
Troubleshooting
After a server upgrade, the Runtime Security screen can be slow for a few days when you query a long period. For the cause and the fix, see the item "Audit log and runtime security queries are slow for a few days after an upgrade" in Troubleshooting.
Related documents
- Security attack detection — detecting attack patterns in HTTP requests
- Risks — managing the security risks of Kubernetes workloads
- Audit logs — Kubernetes and operating system audit events
- Troubleshooting — common problems and how to fix them