6.3. In Observability
Asking around nodes and infrastructure — buttons on charts and logs
In OPENMARU Observability you ask about charts and logs: what a graph means, or what a log line that just appeared is saying, right where you are.
Three entry points
| Where | Button | What you ask |
|---|---|---|
| Chart widget | CogentAI Insight | What is this graph telling me |
| Logs · log viewer | AI button | What does this log line mean |
| Audit logs | AI button | Is this access normal |
1. Charts — CogentAI Insight
This is the AI icon at the top right of a chart widget. It is in the same place even when the chart is expanded to full screen.
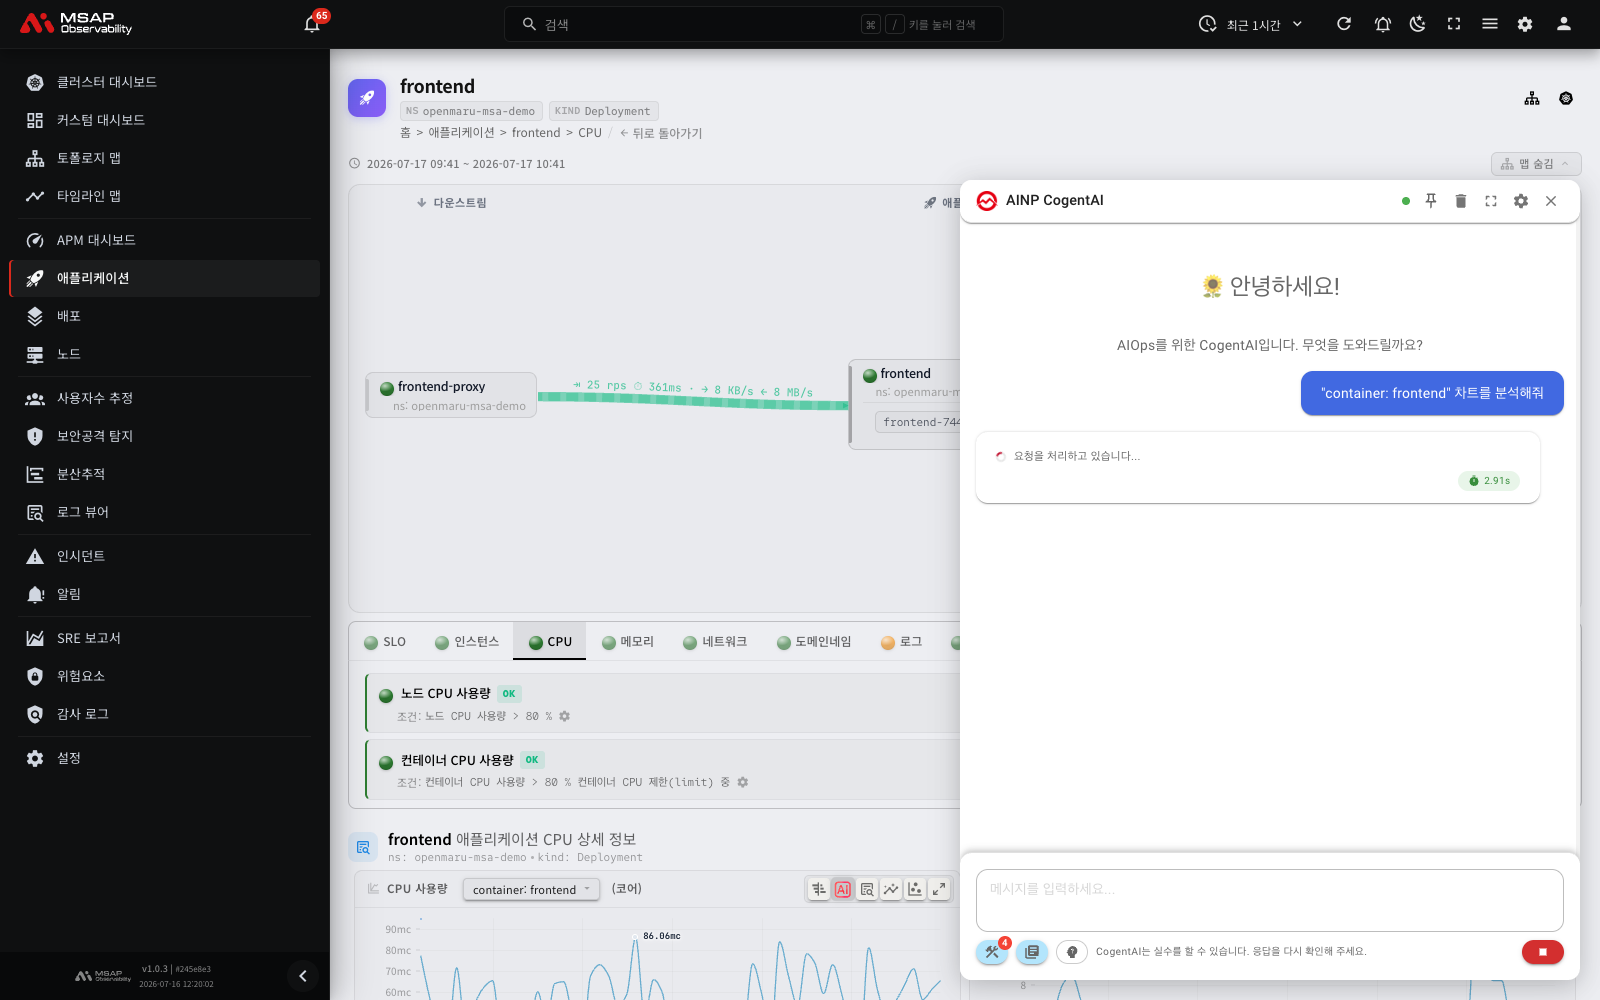
Pressing it is the same as asking this.
"Analyse the
<chart title>chart"
The values drawn in the chart go across with its title. On a screen where several charts are grouped, the group name is included too, giving <group> - <chart name>.
The answer comes back on Kubernetes terms
Chart analysis carries an instruction to answer in Kubernetes terms, which is why the suggested actions come back as kubectl commands.
- In a warning situation it leads with what to do immediately
- For something recurring it puts the weight on the underlying cause
Windows with no values
Windows where collection stopped are deliberately left unmentioned. Even when there is a gap in the graph, the answer does not discuss it.
If the gap itself is what you want to know about, ask separately.
2. Logs
The button is in both the log list and the log viewer. Pick one log line and press it.

"Analyse this log"
It explains what each field means: the timestamp, log level, class and message.
The length of the answer depends on the level
Without knowing this you may wonder why no suggested action came back.
| Log level | What you get |
|---|---|
WARN · ERROR · CRITICAL | An explanation plus a troubleshooting procedure |
INFO · DEBUG · TRACE | An explanation only |
This is deliberate, so that normal-operation logs do not come with suggested actions.
It does not invent hypotheticals of the form "if this were an error, do the following" for an INFO line.
When something is normal, it says only that it is normal. A short answer means there is nothing wrong.
3. Audit logs
Audit logs are looked at from a different angle from the other two: security rather than performance.

There are two kinds, and they are distinguished automatically.
| Kind | What it examines |
|---|---|
| Kubernetes audit logs | RBAC policy, abnormal access, privilege escalation attempts |
| OS audit logs | Abnormal process execution, file access |
What is handed over
More than the raw log goes across: the structured fields go with it.
- Host and user (UID)
- The action performed, the executable and the PID
- Whether it succeeded or failed
- The namespace, for Kubernetes
That is why it can answer "is it unusual that this user ran this at this time?" directly.
Looking at metrics from several angles
When you want the relationship between several metrics rather than one chart, use the Analysis Prompt Builder. The observ datasource has 13 scenarios ready.
| What you want to know | Family |
|---|---|
| Why it got slow | Correlation analysis |
| When it hits the limit | Predictive analysis |
| Whether there is an unusual window | Anomaly detection |
You can choose the apm datasource in the builder too. Both appear in the list even when you open it from an Observability screen (see Chapter 401).
Asking with a free-form question
Type it yourself for anything without a button. Naming the subject and the period makes the answer more accurate.
"Tell me the pod status in
<namespace>" "Were any pods restarted yesterday evening?"
It cannot answer about node disk usage. Kubernetes does not report a node's disk usage (only its capacity). Ask about node resources through CPU and memory instead: "Show me node resource usage".
When the buttons are not there
If the CogentAI integration is switched off in the administrator settings, the buttons are not rendered. The setting comes from the server, so it cannot be turned on from the screen.
If the buttons are there but you get a "not ready" notice, the widget has not finished loading. Wait a moment and press again.
How this differs from the other two consoles
| Observability | COP Console | APM | |
|---|---|---|---|
| Mainly asked about | Charts and logs | Kubernetes resources | WAS and transactions |
| Distinctive behaviour | The answer varies with the log level | The whole resource YAML goes across | The screen is captured as an image and sent |
The widget itself is the same in all three. What differs is where the buttons are and what goes across with them.
Next
- Choosing a metric analysis — Analysis scenarios at a glance
- The other consoles — In OPENMARU APM · In COP Console
- When something goes wrong — When something goes wrong