5.3. Reading execution plans and ERDs
The two figures that come with an answer — the execution plan tree and the table diagram
Ask about a database and you get more than text. A figure comes with it, and there are two kinds.
| Figure | When it appears | What it shows |
|---|---|---|
| Execution plan (tree) | When a query was analysed | The order in which the database processes the query |
| ERD (diagram) | When you asked about a schema | How the tables connect |
Both can be dragged and zoomed. Large figures exceed the width of the widget, so it is worth knowing how to handle them.
1. The execution plan tree
Ask about a slow query and a tree like this comes with the answer. The outermost operation is at the top and the operations that actually read tables are at the bottom.
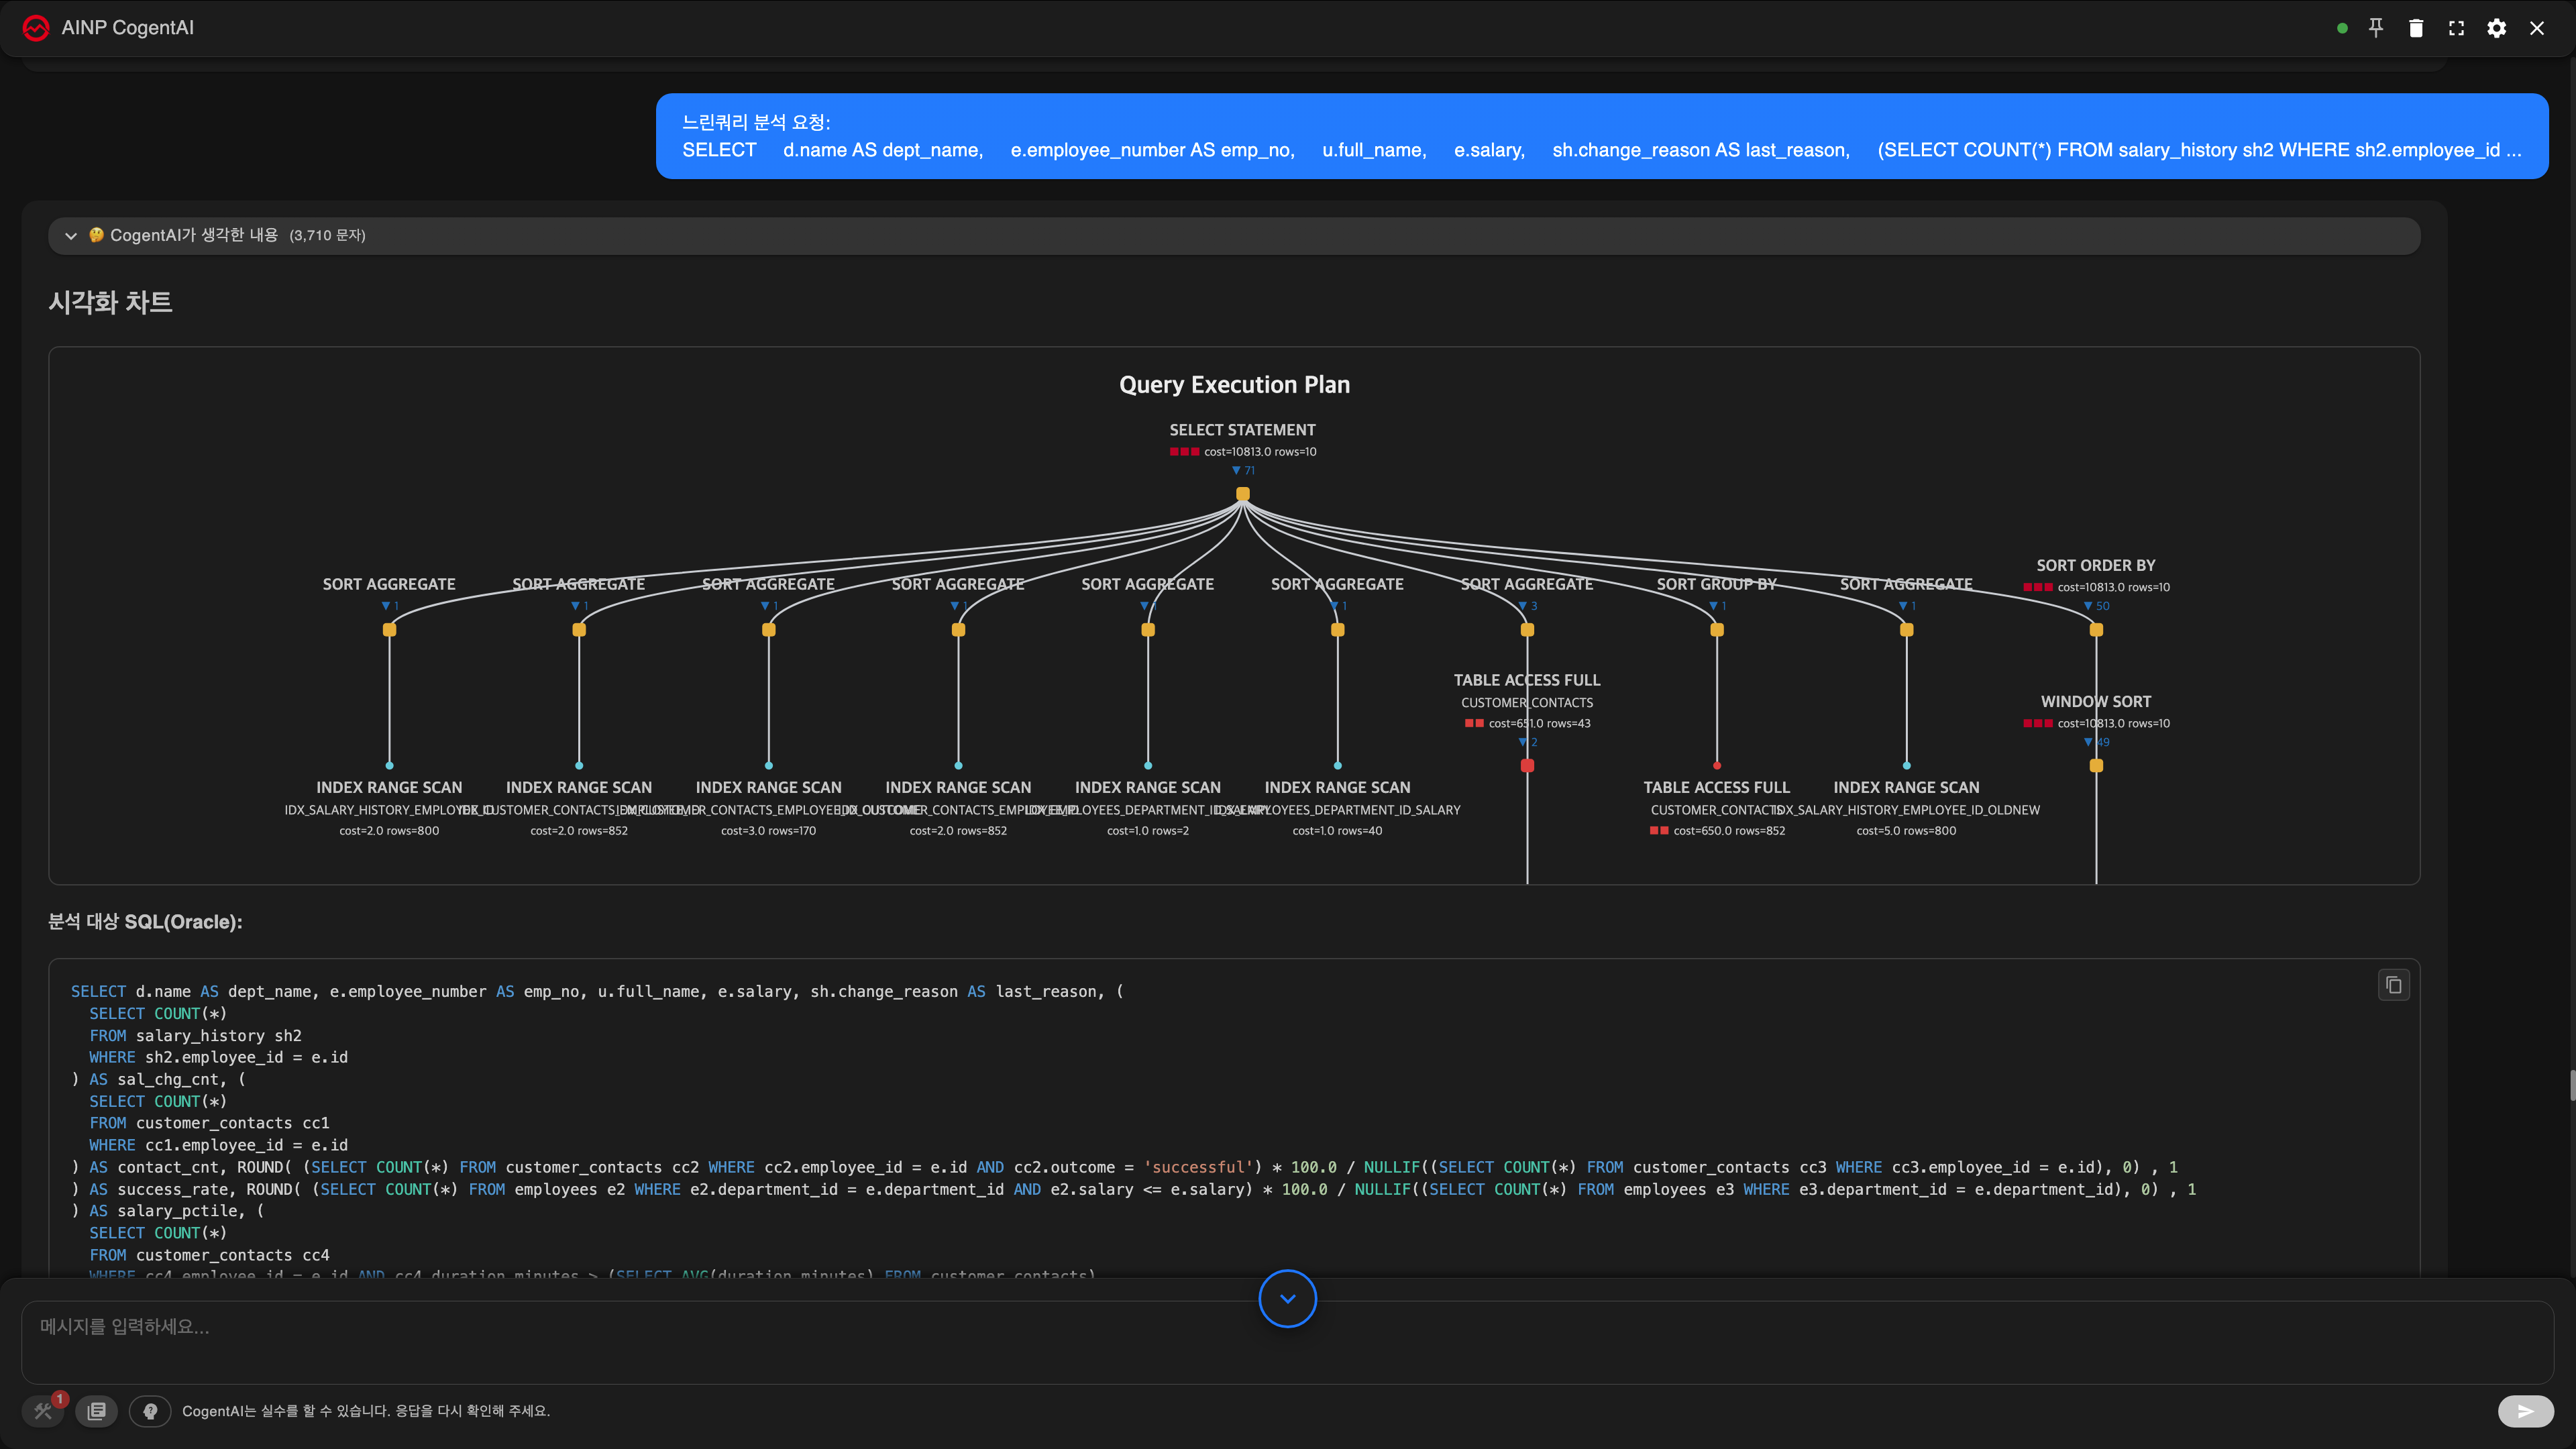
What is written on a node

▼ 3 means three nodes are collapsed underneath. Click the node to expand them.
The colour tells you the access method
A node's colour is decided by how that table was read. This alone is often enough to see where the problem is.
| Colour | Access method | Meaning |
|---|---|---|
| Red | FULL SCAN | The table was read from beginning to end — look here first |
| Yellow | Other | Worth checking |
| Green | INDEX RANGE | Read through an index over a narrowed range |
| Light blue | INDEX | Satisfied from the index alone |
| Blue | UNIQUE | Went straight to one row — the best case |
Start with red. Reading a small table in full is not a problem, but red on a large table is usually the cause.
In the figure above, TABLE ACCESS FULL in the middle is the red node. It stands out at a glance from the INDEX RANGE SCAN nodes around it.
The cost bar ■ is relative
■, ■■ and ■■■ are measured against the most expensive node in this plan. They cannot be compared with the ■■■ of another query.
| Bar | On hover | Meaning |
|---|---|---|
■■■ | Critical | The heaviest step in this plan |
■■ | High | Heavy |
■ | Moderate | Middling |
| (none) | Low | Light |
The cost number itself is an estimate made by the database. It is not seconds. Comparing costs between different databases is meaningless as well. It is a value for seeing which part of the same plan is heavier.
It also comes as a table
Along with the tree you sometimes get the per-step costs summarised in a table.
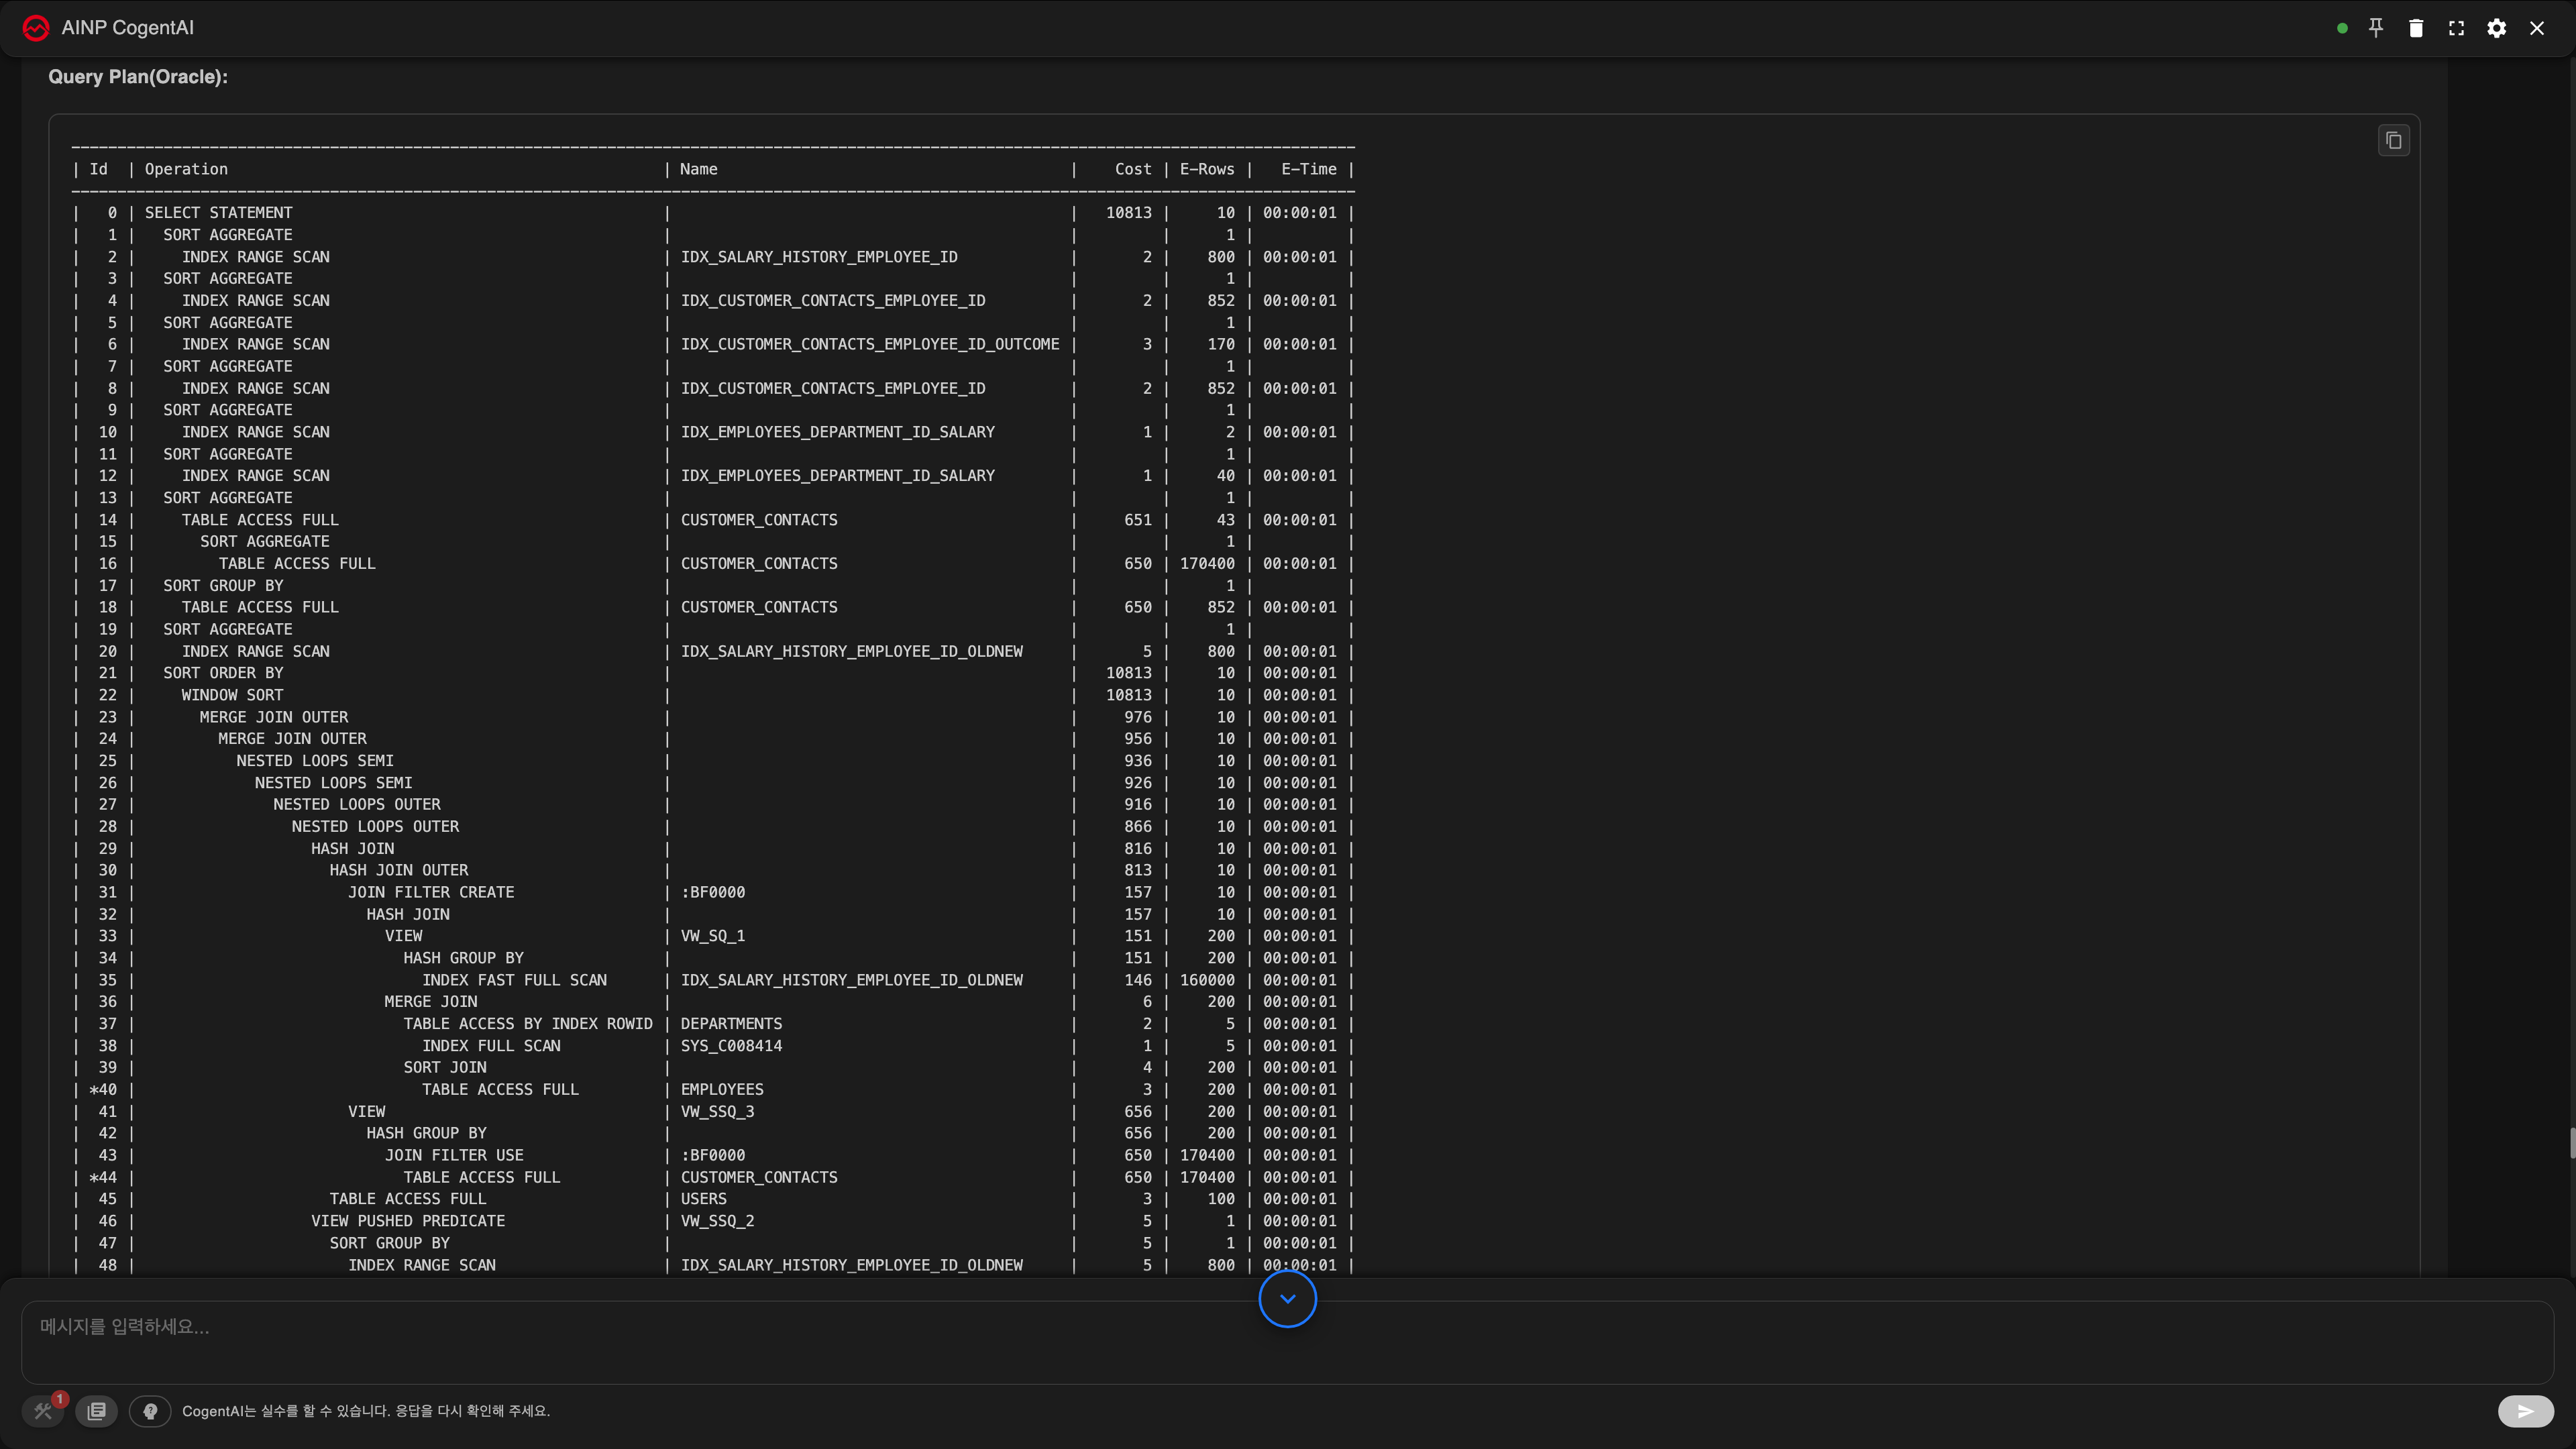
Hovering shows more
Values that do not fit on the label are in the tooltip.
- Access — the access method as written by the database
- Est. Rows / Actual Rows — rows estimated and rows actually read
- Filtered — the proportion left after filtering
- Actual Time — the time actually taken (ms)
- I/O — blocks read and written (
buf,read,write)
A large gap between estimate and actual suggests the statistics are stale. If the database expected 100 rows and read 100,000, that misjudgement is what threw the plan off.
Actual values and I/O may be absent, depending on the database and how the plan was collected. Their absence does not mean anything is wrong.
Telling a leaf from a branch by shape
- Small circle — a final step with nothing below it. This is where data is actually read
- Rounded rectangle — a step with more below it
2. Handling the execution plan
There are buttons at the top right of the tree. They appear only on tree charts such as execution plans.
| Button | What it does |
|---|---|
| Zoom in · Zoom out | A step at a time |
| Fit to screen | Back to the initial view. Start here if you get lost |
| Expand all | Opens every collapsed node at once |
| Full screen | Beyond the widget, to the whole screen. ESC closes it |
You can also work with the mouse rather than the buttons.
- Drag to pan — grab an empty area and drag
- Wheel — zoom in and out
- Click a node — expand or collapse that branch
Looking at a large plan
Beyond about ten steps, the plan overlaps itself at the width of the widget. Full screen → Expand all is the comfortable order. Once everything is open, find the red node and work upwards from there.
3. ERD — the table relationship diagram
Ask something like "show me this schema" and you get a diagram of the tables and their relationships. When a query is analysed, a diagram of the tables involved comes with it as well.
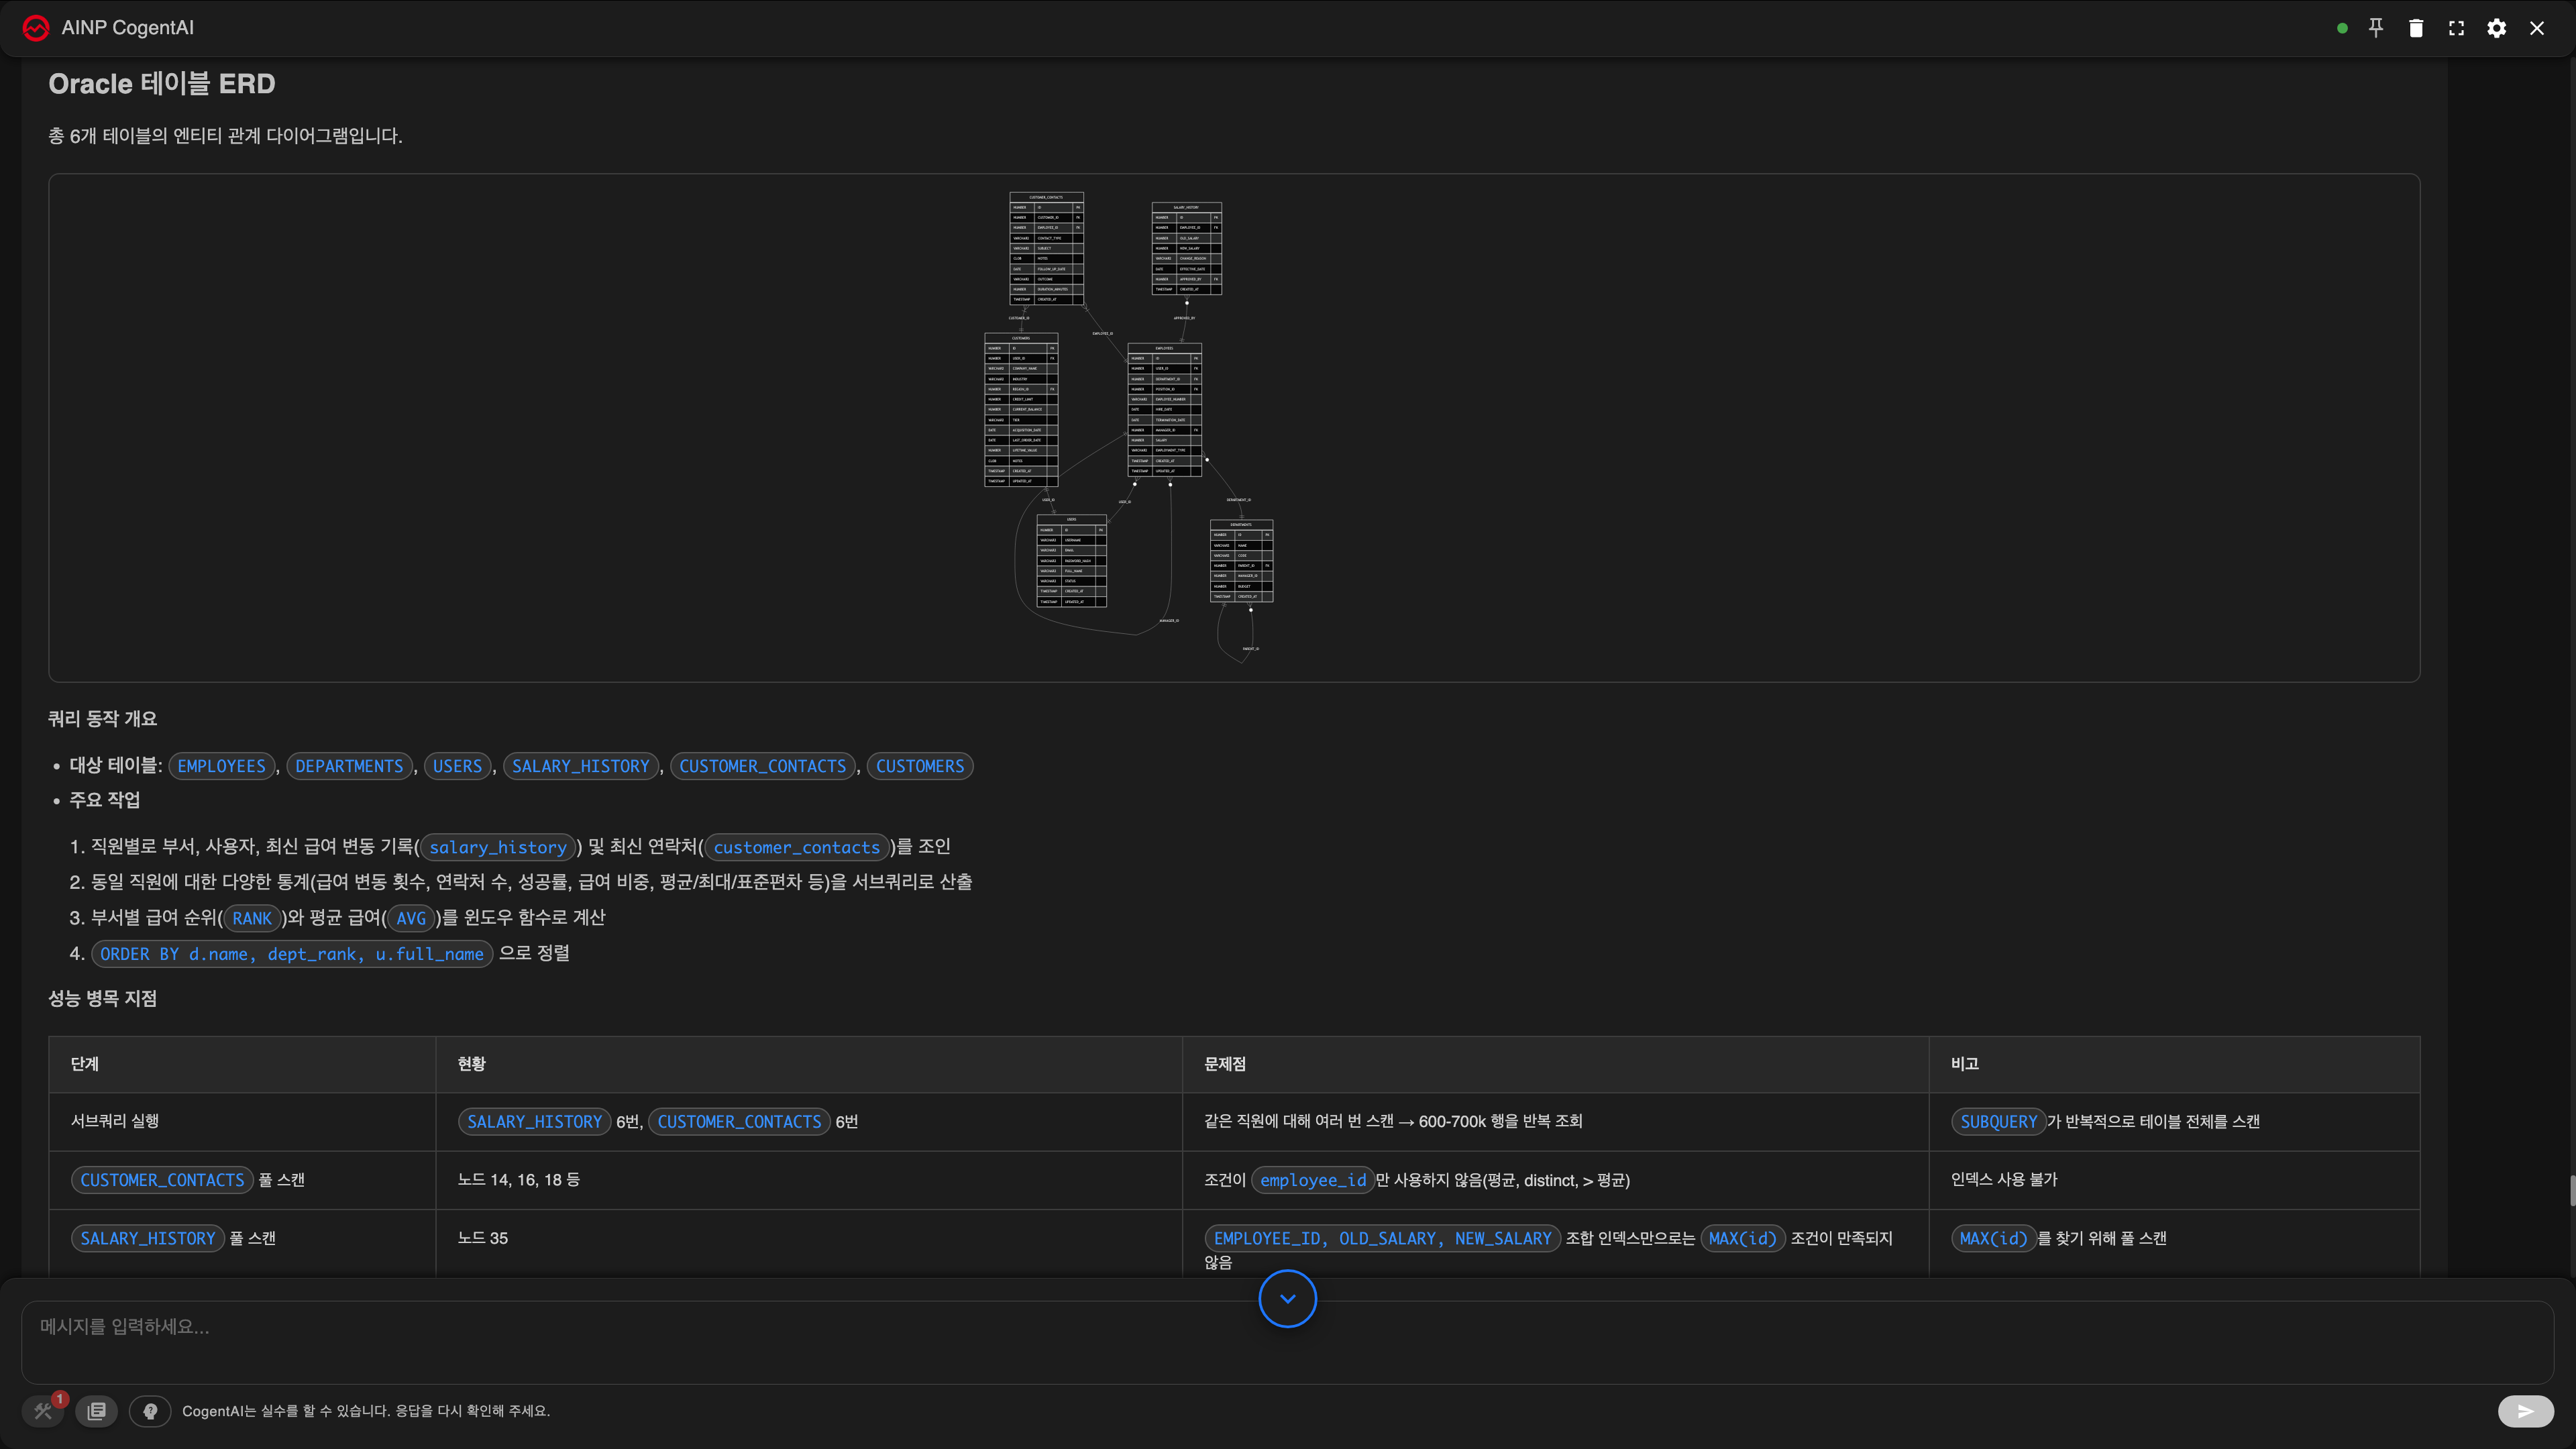
Reading the notation
    ORDERS {
        bigint  order_id     PK
        bigint  customer_id  FK
        string  status
    }

    ORDERS }o--|| CUSTOMERS : "customer_id"
| Notation | Meaning |
|---|---|
PK | Primary key — the column that identifies one row in this table |
FK | Foreign key — a column that points at another table |
| `}o-- | |
| Text on the line | The name of the joining column |
Read the figure above as many orders connecting to one customer. Even without an arrow, the side with }o is the "many" side.
Controls
| Action | Result |
|---|---|
| Drag | Pan |
| Wheel | Zoom in and out around the pointer |
| Reset button | Back to a view that fits the screen |
| Full screen button | The whole screen. ESC closes it |
Turning the wheel over a diagram zooms the diagram instead of scrolling the conversation. To scroll the conversation, put the pointer outside the diagram.
An ERD is a summary — it leaves three things out
It is not the schema as it is. To keep it readable, the diagram omits the following.
One. At most ten columns are shown per table.
Beyond that, the last line only states how many remain, as in more__12_columns. If you are looking for a particular column, ask again in words instead: "Show me all the columns in the ORDERS table".
Two. Only one line is drawn between any two tables.
Even if ORDERS points at USERS twice (orderer and recipient), only one line appears. Do not use the diagram to count relationships.
Three. Special characters in names become underscores.
order-items appears as order_items in the diagram. Copying a name from the diagram into a query can leave you unable to find the table.
Because of these three, use an ERD to see "how things connect" and ask again in words when you need exact column names and types.
4. When the figure does not appear
There is a space but it is empty
Press Reset (ERD) or Fit to screen (execution plan). After zooming, the figure may have been pushed outside the visible area.
"Mermaid rendering error" appeared
The diagram syntax was malformed. The source is shown below the error as it is, so you can see what the problem was. Asking again usually produces a normal result.
There is no execution plan at all
If a query analysis comes back without a plan tree, the plan could not be fetched from the database. You may not have permission, or the query may be of a form whose plan cannot be retrieved. Check whether the answer text states the reason.
Next
- How to produce these figures — Diagnosing SQL straight from APM
- What else you can ask — What you can ask a database
- Handling other charts — Reading answers — tables, charts, diagrams