7. Server View
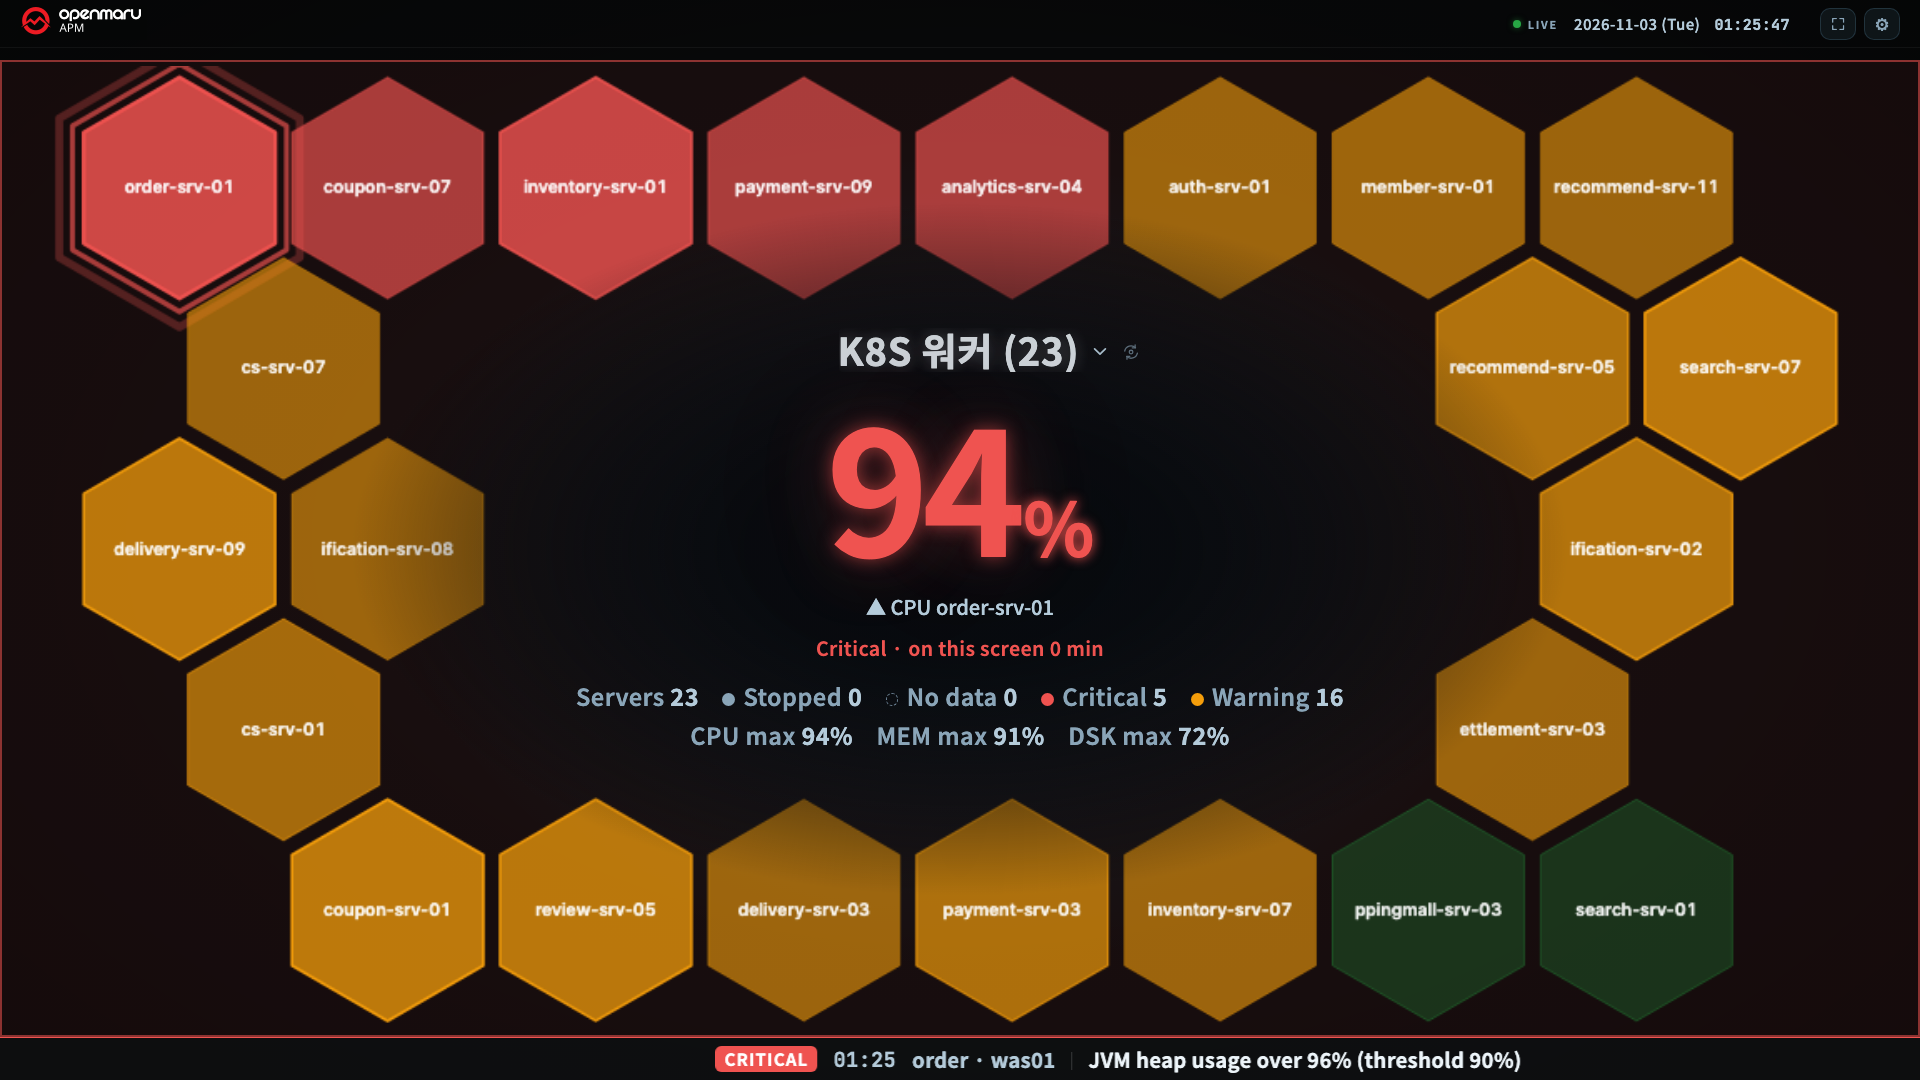
The Server view shows, per tile, the server metrics that SYS agents send. There are three metrics: CPU, memory (MEM), and disk (DISK).
Network data arrives in bits per second, but the agent does not send the link speed, so usage cannot be calculated. Without usage, no threshold can be set either, so it cannot be used for judgment on a wall screen. Network problems are reported by event policies (alert policies), and those events appear in the alert band (chapter 8).
Opening the Server View
| Method | Scope |
|---|---|
| Press the TV icon on a screen under Server in the console's left menu | All tiles |
| Settings (gear) ▸ Layout ▸ View ▸ Servers | All tiles |
| Press a tile title and choose → Server view in the Switch view set | That tile only |
?view=sys in the address | All tiles (not saved) |
To turn a server tile back into an application tile, choose → Application view in the same place.
First, Create Server Groups (Administrator)
A server tile usually shows one server group. An administrator creates server groups in the console under Access Management ▸ Server Groups.
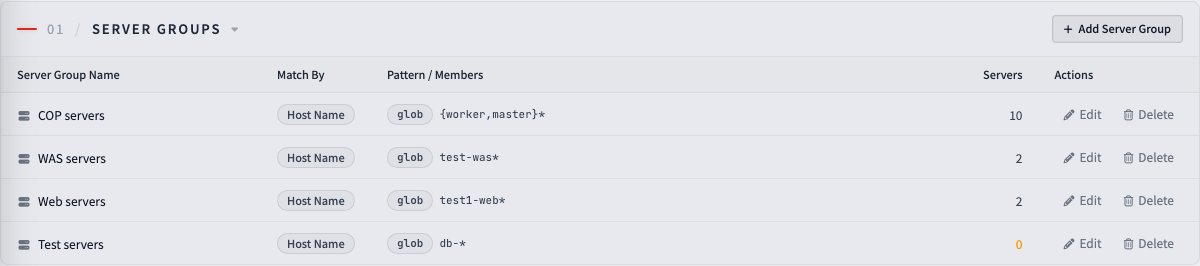
- For how to create server groups, see chapter H22 of the User Guide.
- If there are no server groups at all, the wallboard groups tiles by application group. It treats servers whose IP matches a WAS server IP of the application group as that group's servers. In that case, the line "No server groups — grouping by application group" shows under the server thresholds in Settings.
- In container environments, the WAS IP and the server IP differ, so most servers land in No group. In that case, create server groups.
- The wallboard reads the server group settings again every 10 minutes. If a change does not show right away, wait 10 minutes or refresh the wallboard.
What a Tile Shows
| Target | Servers in the tile |
|---|---|
| Server group | Every server in that server group |
| All | Every server you can see |
| No group | Servers that are in no server group |
| Application group | Servers whose IP matches a WAS server IP of that application group |
| Server | The one server you chose |
- The server count in a tile matches the count on the Access Management ▸ Server Groups screen. A server is identified by its IP and host name together, so two servers with the same IP count as two.
- Servers that have not connected yet after the APM server (collection server) restarted are not dropped from the tile; they show as Stopped. Stopped means the server's SYS agent is not connected to the APM server.
- A server in more than one server group can show in more than one tile.
Reading the Large Number
The large number in a server tile is the worst metric value of the worst server in the tile.
93%                        ← large number: worst metric of the worst server
▲ CPU was-srv-11           ← metric name and server name (partition name too, for disk)
Critical · on this screen 3 min  ← grade, and time since this screen first saw that grade
- It picks from servers that have values. The order is Critical → Warning → Normal; within the same grade, the server with the higher metric value wins.
- Stopped and No data servers are not candidates for the large number. This keeps one stopped server from hiding another server's high disk usage. Stopped and No data servers show in the summary counts below and as gray hexagons in the hive.
- If every server in the tile is stopped or has no data, the large number area shows
StoppedorNo datawith the last received time. - With no Critical or Warning server, it shows only the highest value in the whole tile, without a server name (for example
52%CPU). Showing a server name in large text while everything is normal makes that server look like a problem. - The server the large number points to changes only when grades change. If the top server kept switching as values rose and fell slightly, it would be hard for the eye to follow.
- "on this screen n min" counts from when this wallboard screen first saw that grade. Different TVs can show different values.
The Summary Under the Large Number
| Row | Content |
|---|---|
| First row | Servers n · Stopped n · No data n · Critical n · Warning n |
| Second row | CPU max · MEM max · DSK max: the highest value per metric across the servers in the tile |
No data is a server whose agent is running but whose metric values do not arrive. It is not counted as 0%.
The Hive Visual
The default hero for a server tile is Hive. It draws one hexagon per server in the tile.
| Hexagon | Meaning |
|---|---|
| Pale green | Normal |
| Amber / red, border pulsing | Warning / Critical. The higher that server's CPU, the faster it pulses |
| Gray fill | Stopped |
| Dashed gray | No data |
| Hexagon with extra outer glow | The server the large number points to |
- When a hexagon is large enough, the server name shows inside it. For long names, it drops the beginning that the servers in the tile share
and keeps the rest. If server names differ only at the beginning, such as
order-srv-01andpayment-srv-04, they show as-srv-01and-srv-04. - When new values arrive (every 10 seconds), one ring spreads out from the hexagon of the server the large number points to (or from the center if there is none). A server whose grade changed moves its hexagon to the new position.
Mini Tiles
When a server tile is smaller than 460×360 (for example 16 tiles at 1080p), it becomes a mini tile. A mini tile draws a small hive and one summary line under it.
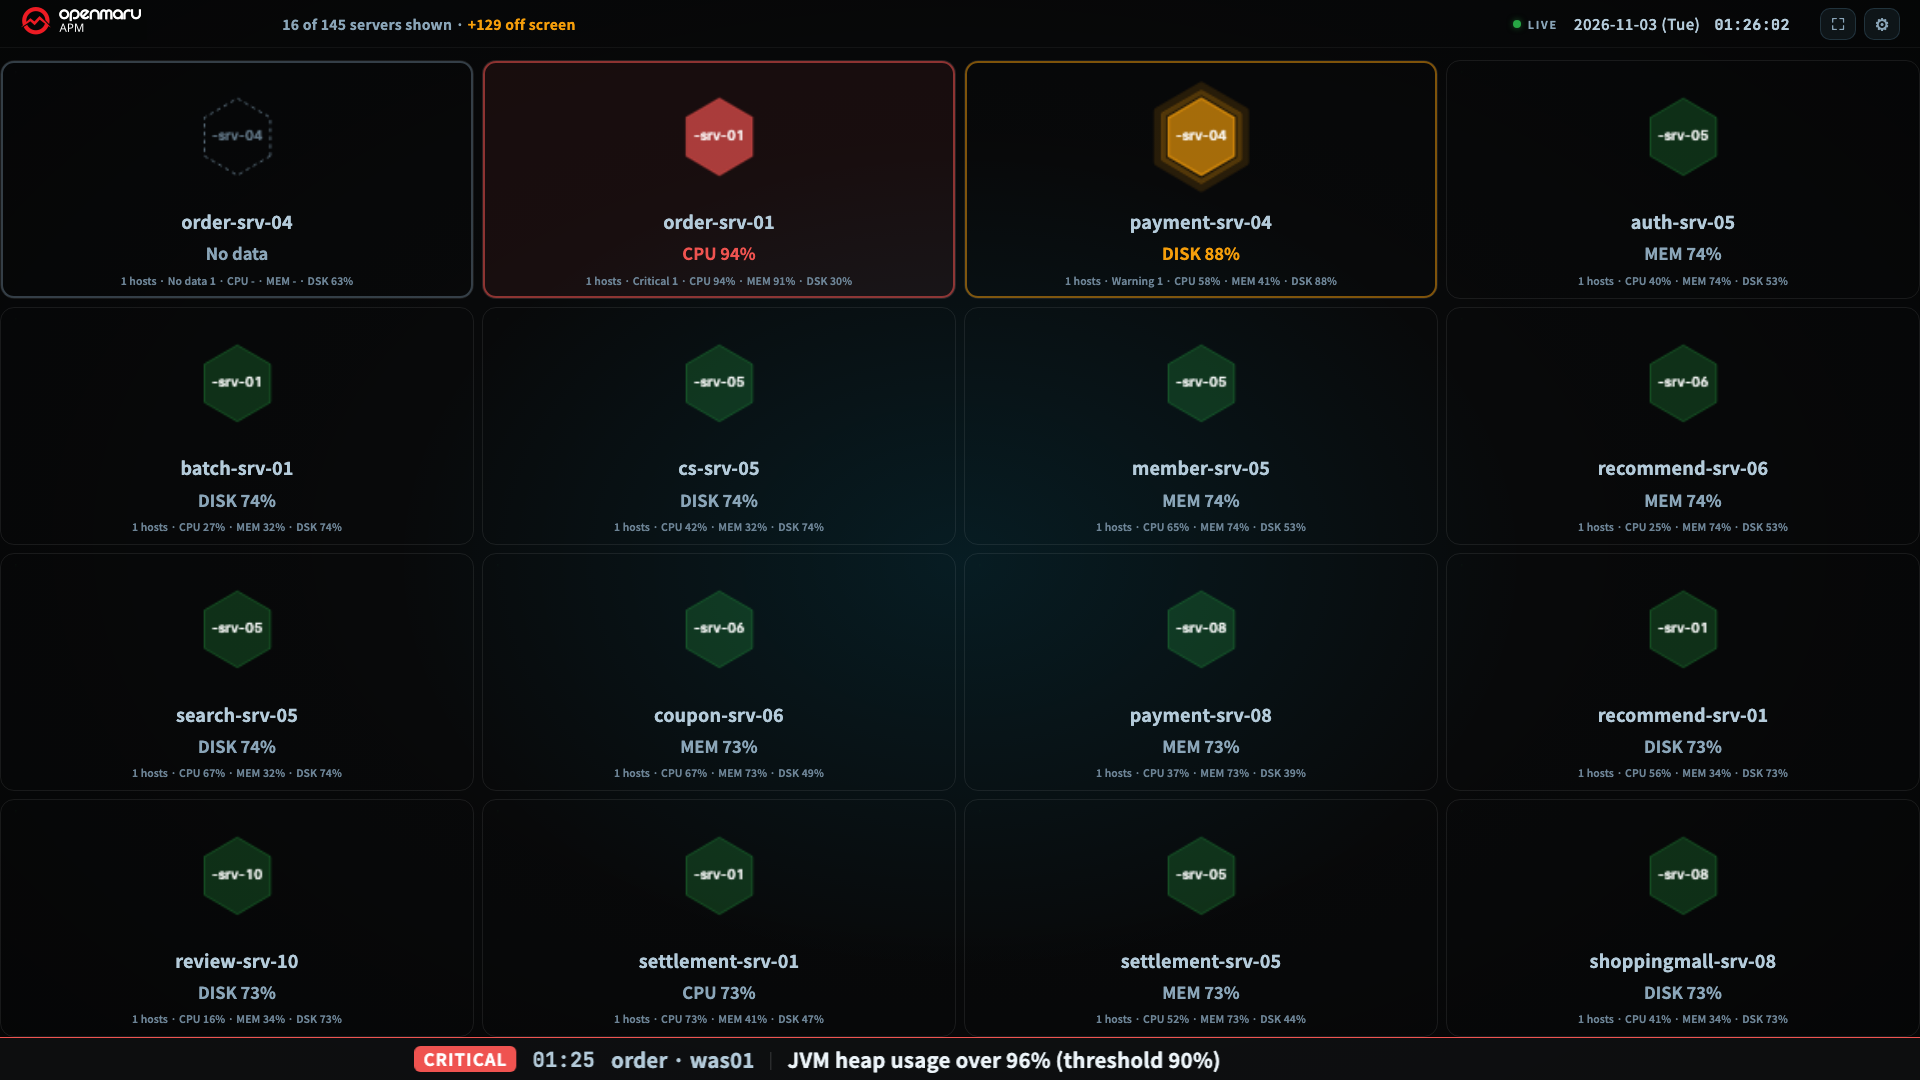
20 hosts · Critical 1 · CPU 58% · MEM 73% · DSK 88%
Stopped, No data, Critical, and Warning appear only when they are not zero.
Server Thresholds
Server tile colors come from Settings ▸ Server thresholds. There is one set for the whole screen, not one per tile. Values move in steps of 5.
| Metric | Warning (default) | Critical (default) |
|---|---|---|
| CPU % | 80 | 90 |
| MEM % | 90 | 95 |
| DISK % (highest value among partitions) | 85 | 95 |
- The Warning defaults match the thresholds of the console's server dashboard cards.
- This set appears in Settings only when there is a server tile on the screen.
- If you add a value such as
?sysThr=80/90,90/95,85/95to the address, those values are used and the server threshold buttons in Settings are locked.
Copyright (c) 2026. OPENMARU, Inc.