8. Alert Band
The large number tells you how bad the state is, but not what happened. The alert band shows events created by the console's alert policies, one line at the very bottom of the screen.
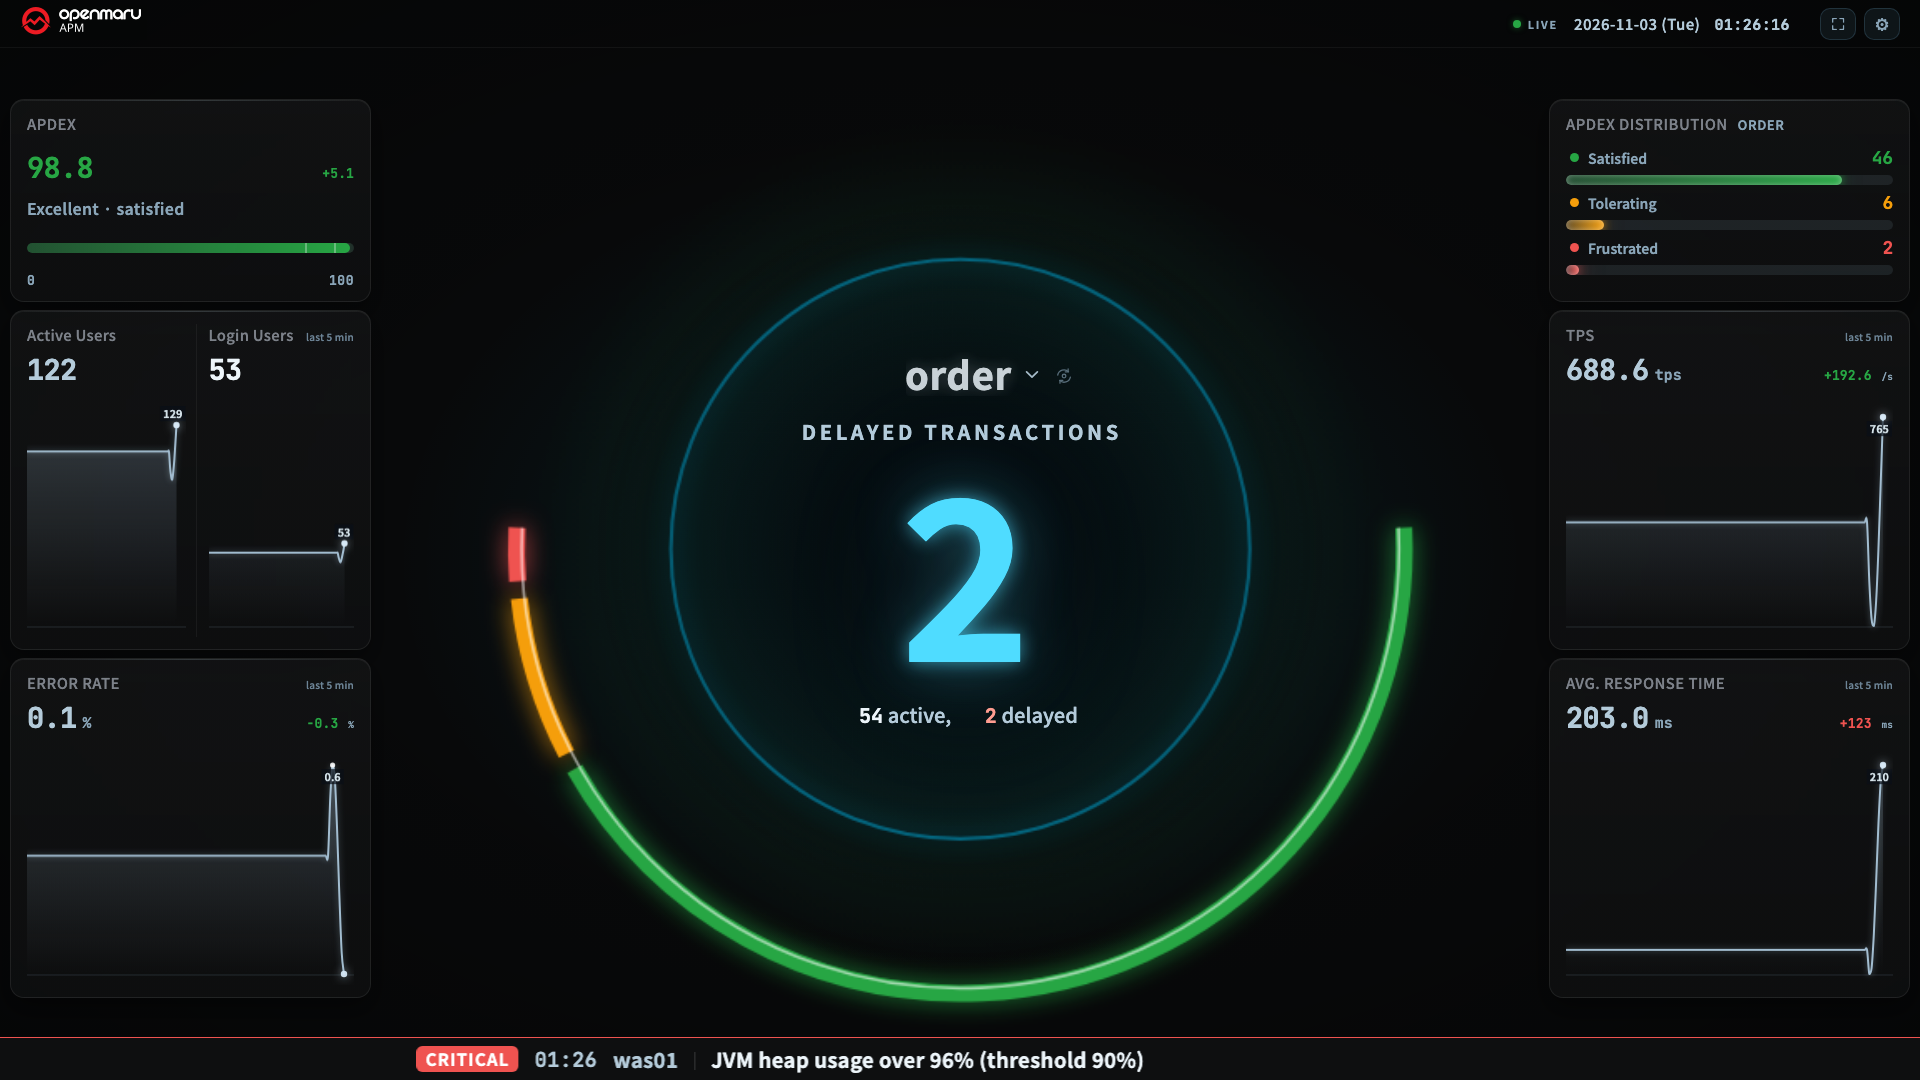
[CRITICAL] 14:19  payment-WAS · was03   JVM heap usage over 96%            1/3
 ↑level     ↑time  ↑target               ↑message                         ↑position
What Appears in the Band
-
Levels: only Critical and Warning are shown. Informational events do not appear.
-
An item stays for 1 minute after it last occurred. When the same event comes again, only the time and message change.
-
With several items, Critical comes first, then newest first. The count shows at the right end. In Rotate mode, the position of the item now showing is shown with it, such as
1/3. -
When an agent starts again, the stop alert for the same target is removed from the band.
-
Which alerts appear depends on the screen layout.
Screen layout Alerts in the band Only application tiles Alerts for the groups the tiles are showing + alerts that belong to no group A tile showing the all-groups group ( [0]ALLand so on)All alerts Only server tiles All alerts -
On a split screen, the group name comes before the message.
When the Band and the Large Number Disagree
The band says what happened, and the large number says how bad it is. A red band with a green large number is a normal state that means "there are no delays, but something happened." For example, one agent has stopped but the others are handling requests well.
With No Alerts, the Band Is Empty
With no alerts, the band shows no text at all. It does not say "no alerts." The band keeps its space, so tile sizes do not change as alerts come and go.
Choosing the Display Mode and Levels
Choose them in the two rows under Settings (gear) ▸ Alert thresholds. When there is a server tile on the screen, they are under the server thresholds.
| Item | Values | Default |
|---|---|---|
| Alert band | Off: removes the band's space too · Rotate: the line stays still and changes to the next item every 6 seconds · Scroll: the line moves from right to left | Scroll |
| Levels | Critical · Critical + Warning | Critical + Warning |
- The Scroll speed is 100 pixels per second at 1080p and changes in proportion to the screen width.
- With reduce motion turned on in the operating system, Scroll shows as Rotate even if you choose it.
- You can also set it in the address with
?ticker=off,?ticker=flip(Rotate), or?ticker=crawl(Scroll).
When the Band Is Always Empty: Check the Receive Status
From the screen alone, you cannot tell whether an empty band means "there are no alerts" or "alerts are not being received." Check the small text just below the Alert band row in Settings.
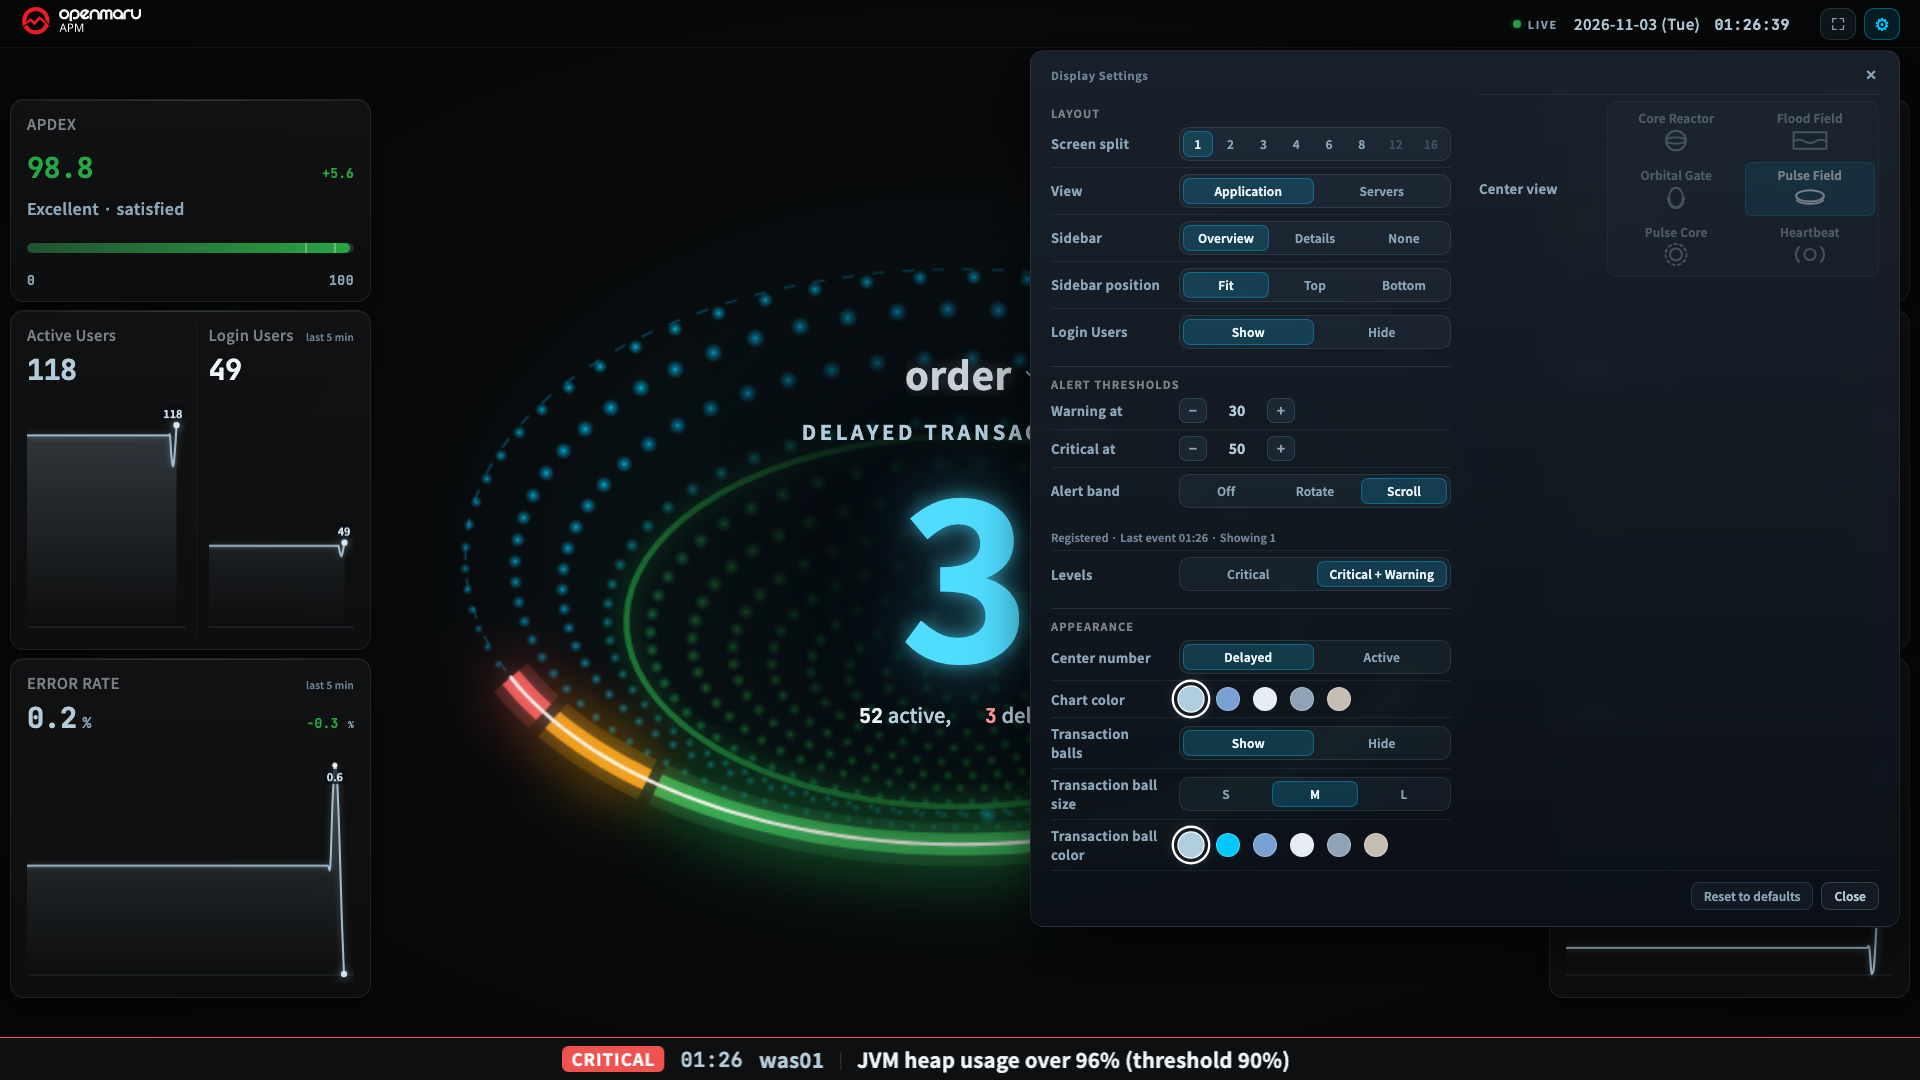
Registered · Last event 14:21 · Showing 2
| Text | Meaning |
|---|---|
| Connecting / Connected / Registered / Disconnected | State of the event receiving connection. Registered is normal |
| Last event HH:MM | When the last event was received |
| No events received | Nothing has been received since connecting |
| Showing n | Number of items in the band now |
The wallboard receives events with the permissions of the account logged in on the TV PC. If that account is not a recipient of the alert policies, no events arrive and the band is always empty. Add a dedicated wallboard account to the policy recipients. Alert policies are set up in chapter H15 of the User Guide.
Copyright (c) 2026. OPENMARU, Inc.