4. Reading the Large Number and Its Color
The large number in the center of an application tile is the value you look at first on this screen. This chapter is based on the application view. For the large number in the server view, see chapter 7.
What the large number counts
By default, the large number is the delayed transaction count: the number of requests currently being processed whose response is running late. You can change what it counts under Settings ▸ Appearance ▸ Center number.
| Center number | Label above the large number | Text under the large number |
|---|---|---|
| Delayed (default) | Delayed Transactions | 48 active, 11 delayed (with no delays, Normal · 48 active transactions) |
| Active | Active Transactions | 11 delayed |
What the color tells you
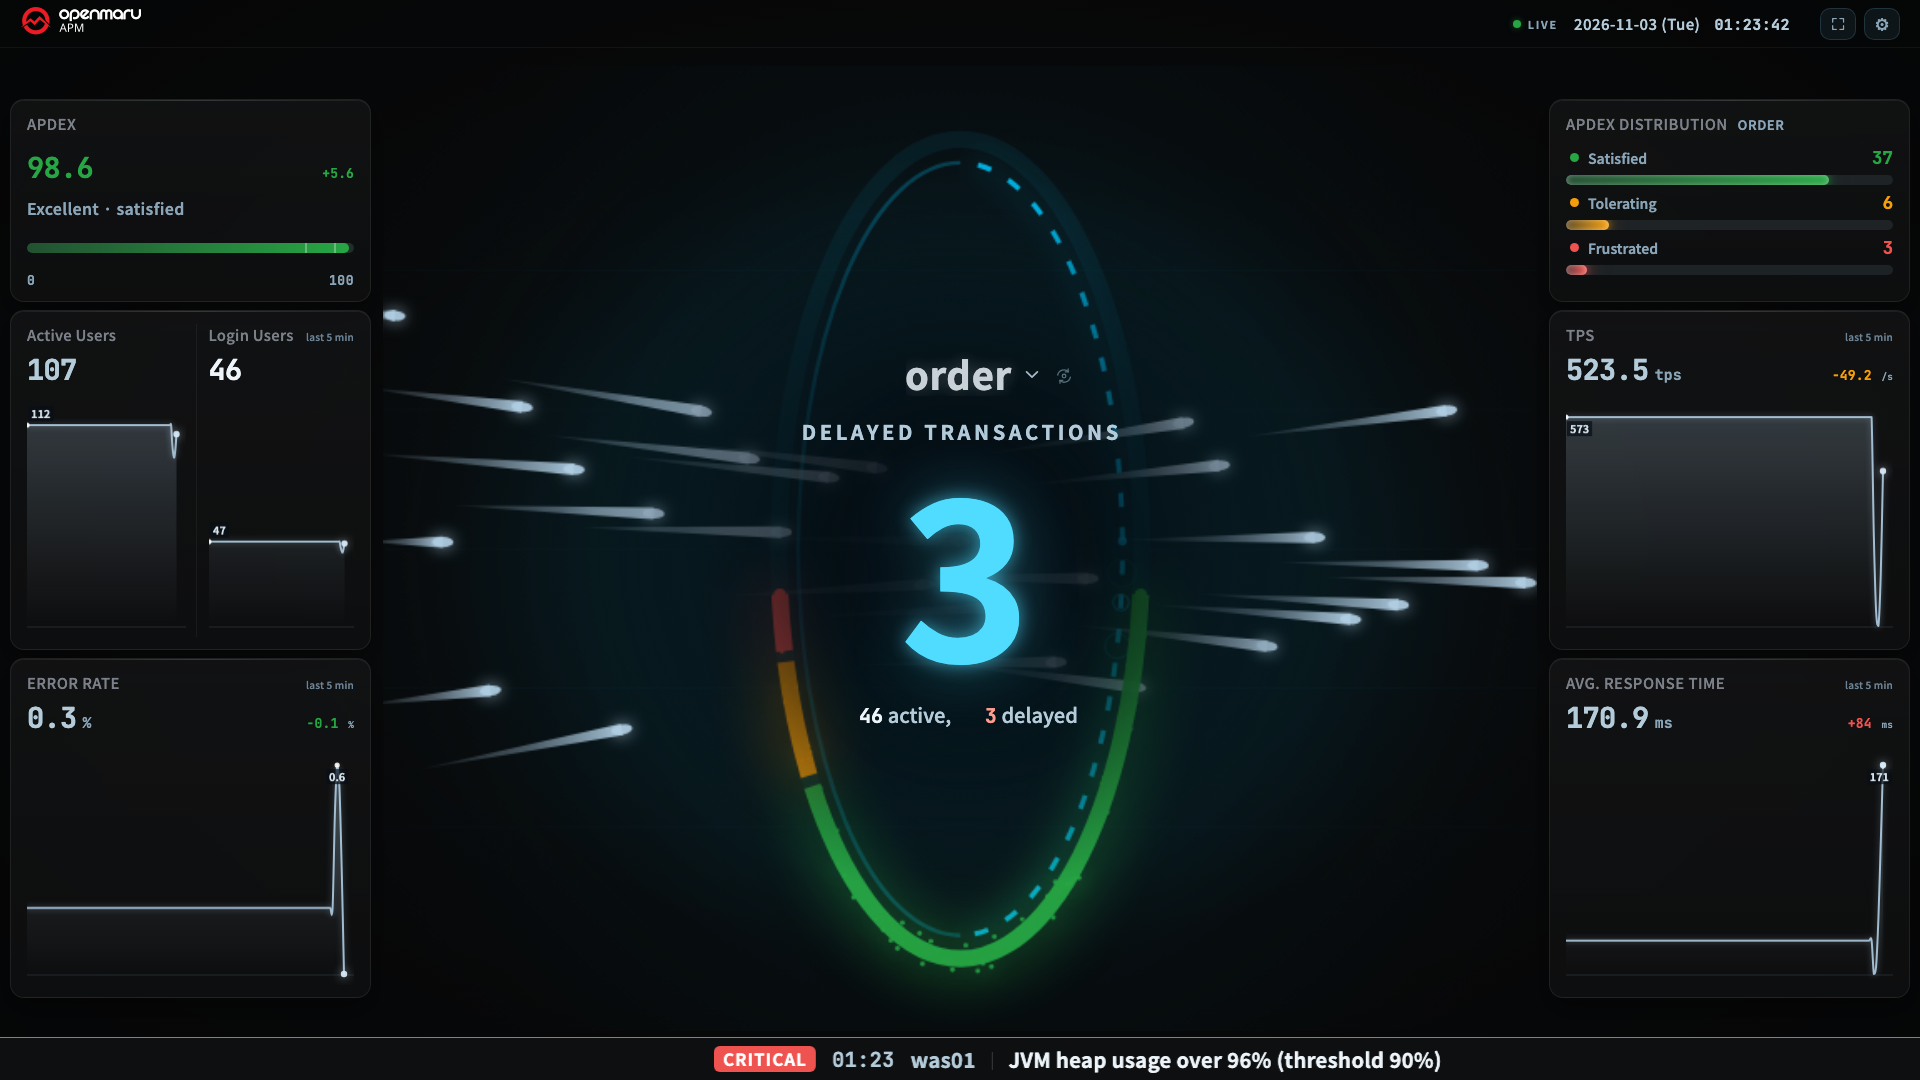
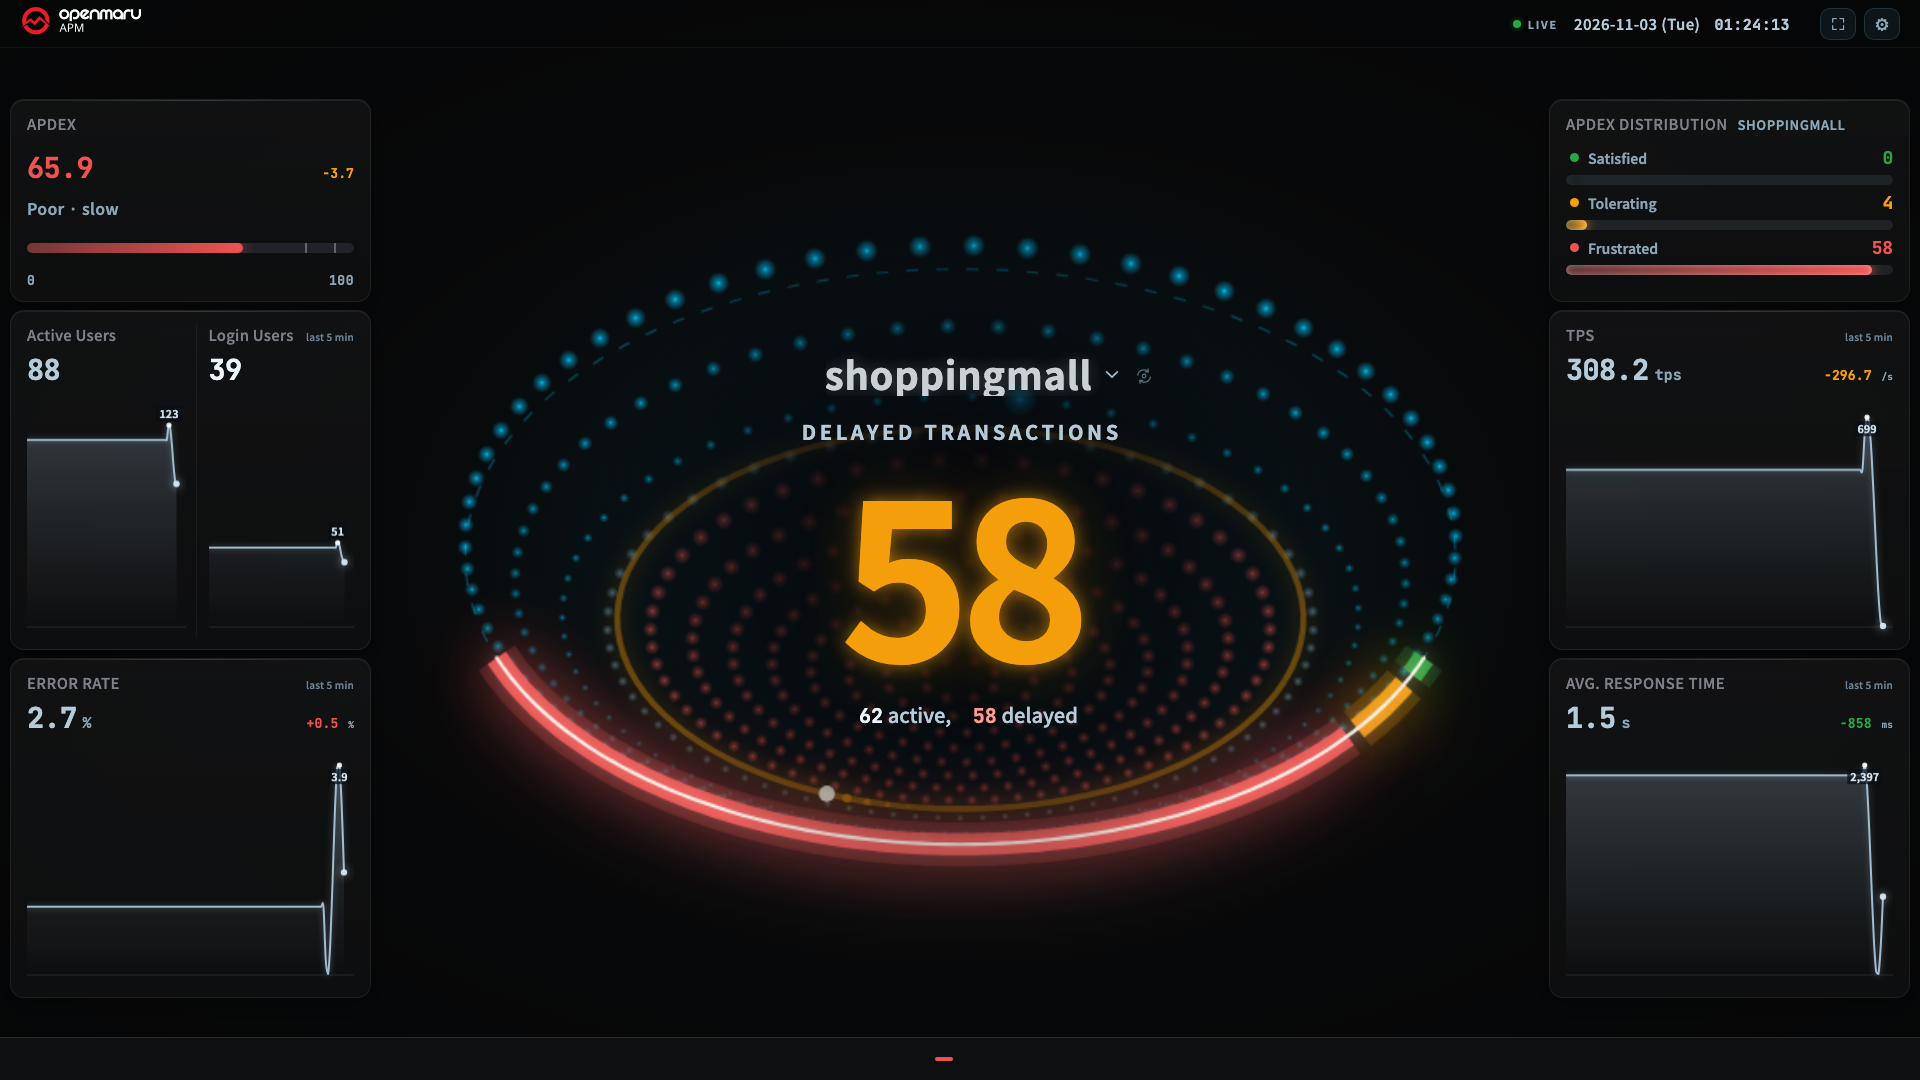
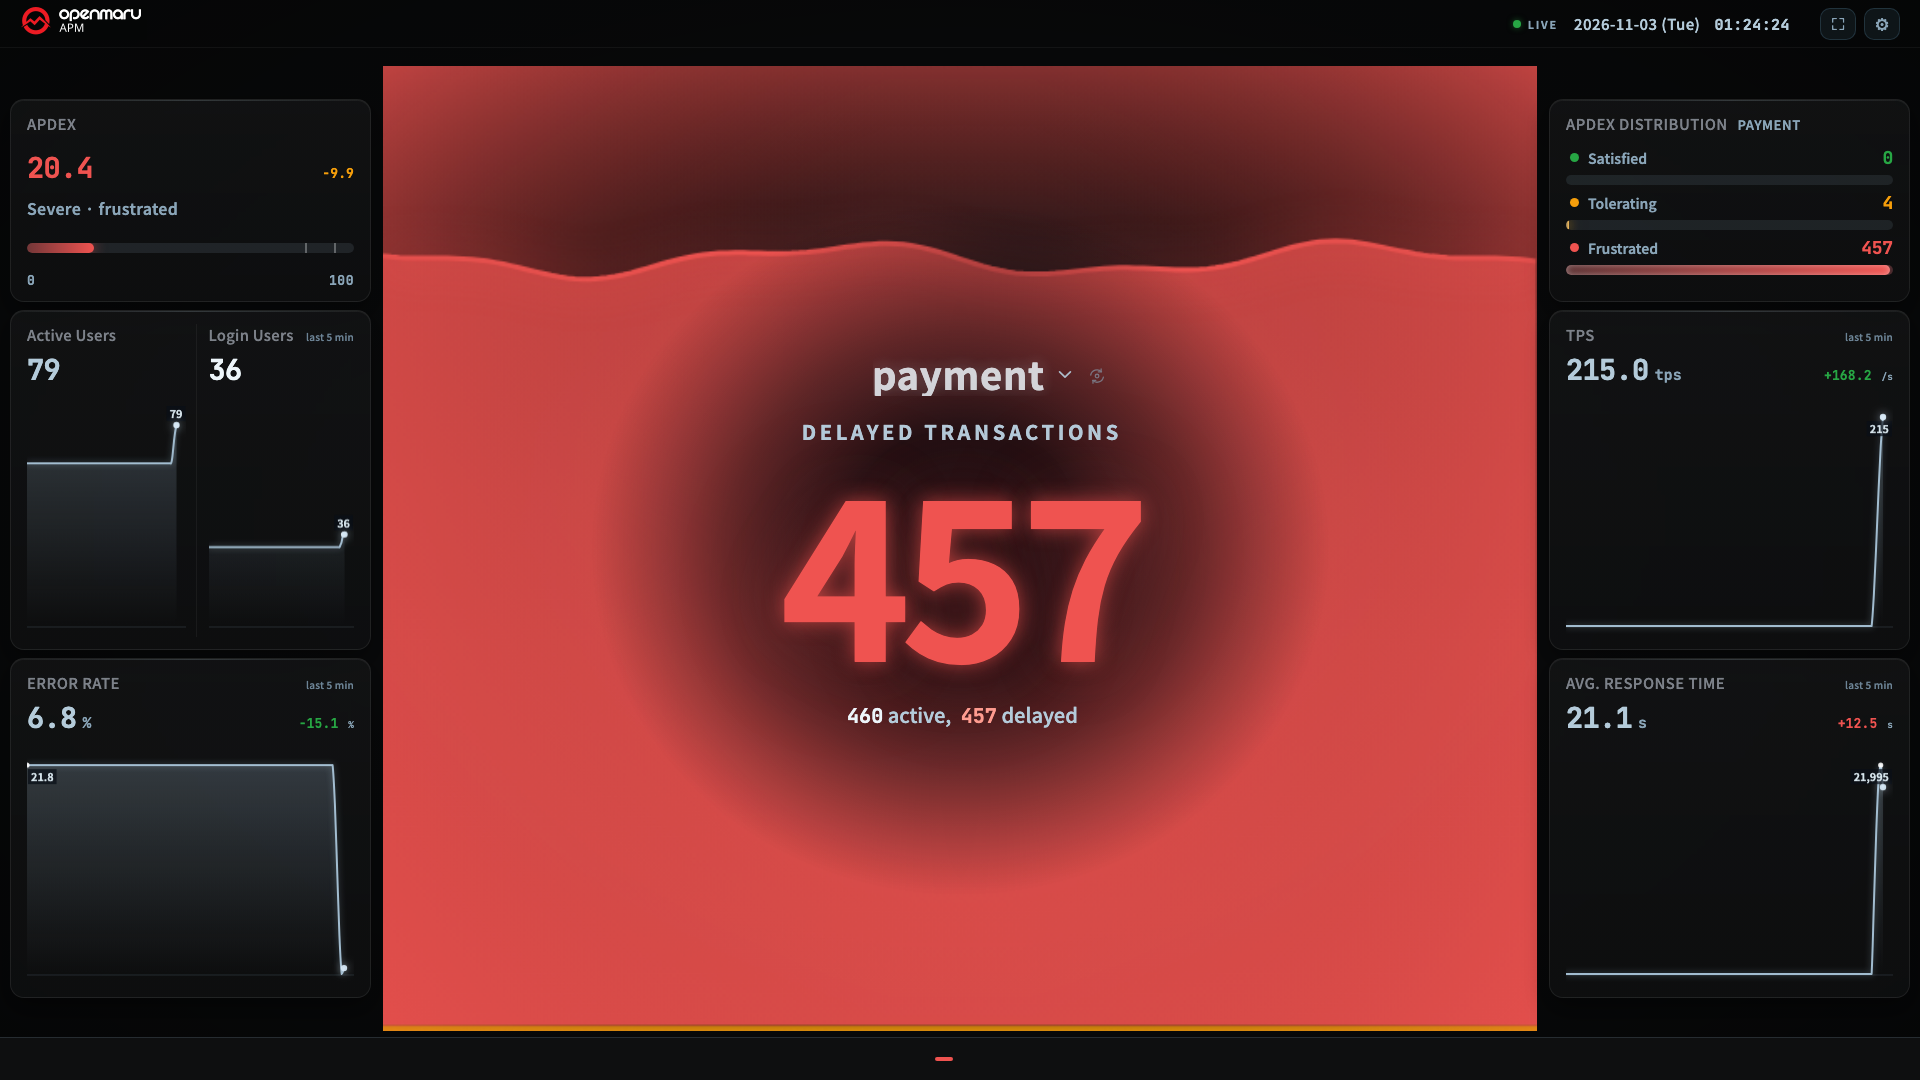
The three pictures each use a different hero. Whichever hero you select, the color and the number are judged the same way (chapter 5).
| Color | Meaning | Default threshold |
|---|---|---|
| Cyan | Normal | Below the warning threshold |
| Amber | Warning | 30 or more delayed |
| Red | Critical | 50 or more delayed |
- The color is always decided by the delayed count. Even if you switch the center number to the active count, the color is judged by the delayed count.
So an active count of
62can appear in red. In that case, then delayedin the text below is the reason it is red. - When you view several groups, the counts are not added up; the worst group decides the color. If 20 groups each have 3 delayed, the total is 60, but no single group has a problem.
- It is a count, not a ratio. The same 9 delayed is 90% of 10 active, but 9% of 100 active. Judging by count keeps the measure the same as the alert policy notifications.
Worsening at once, recovery after 6 seconds
- A worsening appears on the screen immediately.
- A recovery waits 6 seconds before the color goes down. This keeps the color from flickering when the value moves up and down near a threshold.
So the red on the TV can appear up to about 10 seconds before the alert email (chapter 1).
Green, amber, and red appear in two places
The three colors appear in two places, and they say different things.
| Where | What it divides |
|---|---|
| The color band (arc or ring) in the hero visual | Transaction state: normal / delayed / pending. Its position differs by visual (in Core Reactor, it is the tilted ring below the large number) |
| The "Apdex Distribution" card in the right sidebar | How it felt to users (APDEX): Satisfied / Tolerating / Frustrated |
- While counts are small, the color band grows in proportion to the count; past a certain number it switches to proportion. When there is no count, the arc is short too.
- The Apdex Distribution card divides responses by how fast they felt to a person. If the delayed count is low but "Frustrated" is high here, the count is small but slow requests are mixed in.
Setting the alert thresholds to suit the workload
The default thresholds (Warning at 30, Critical at 50) do not fit every workload. For a workload that normally has 40 delayed, the screen is always amber, and then nobody notices when it really gets worse. A warning that is always on does not work as a warning.
- Watch for a few days how many delayed transactions that workload normally has.
- Under Settings (gear) ▸ Alert thresholds, raise Warning at above the normal value.
- Raise Critical at above that.
- You adjust in steps of 10 (10 to 500). The thresholds judge a screen viewed from 3 m away, so precision to a single unit means nothing, and two buttons are enough, so you can adjust it in front of the TV with only a mouse.
- If you raise Warning above Critical, Critical rises with it. Conversely, if you lower Critical below Warning, Warning goes down with it.
- There is one threshold for the whole screen. You cannot set different thresholds per tile.
- The thresholds are saved in that browser. If you only replace the TV they stay as they are, but if you change the PC or the browser you must set them again. Alert thresholds cannot be set in the address (chapter 9).
If you set the wallboard alert thresholds and the delayed count threshold of the alert policy to the same values, the color on the TV and the alert email point to the same situation. Alert policies are set in chapter H15 of the User Guide.
Copyright (c) 2026. OPENMARU, Inc.