2. The Screen at a Glance
The wallboard pictures in this guide were made with sample data. The group names (order, payment, and so on),
server names, and numbers are not values from a real production environment.
Two views
Each tile of the wallboard shows one of two views.
| View | What one tile shows | Large number |
|---|---|---|
| Application view | Transactions of one application group | Delayed transaction count |
| Server view | CPU, memory, and disk of one server group or one server | The worst usage of the worst server |
You can set the view for each tile separately, so one screen can mix both views (chapter 6).
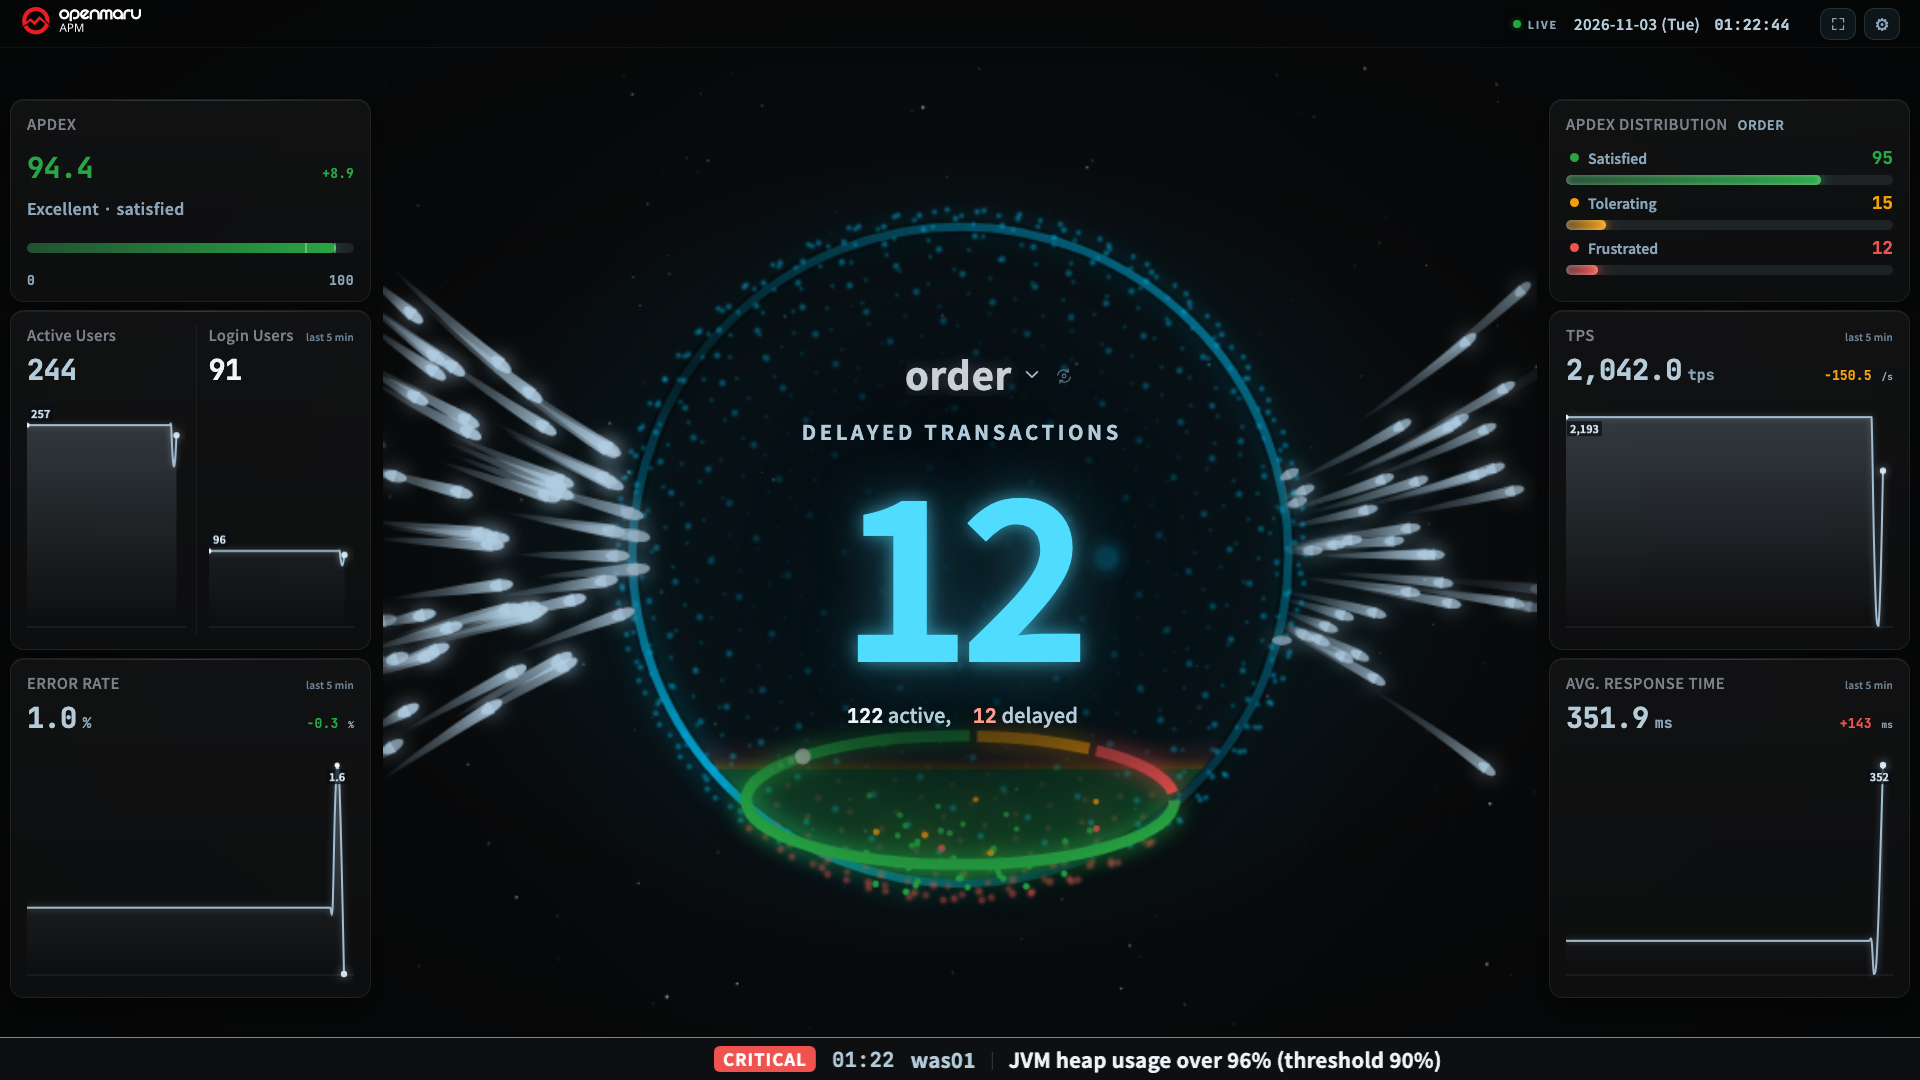
Application view
| Area | What it shows |
|---|---|
| Center (hero) | The large number and a moving visual. This is the area you look at first. The moving visual in the center is called the hero (chapter 5) |
| Title | The name of the application group you are viewing. Click it to switch to another group |
| Summary under the large number | One line, such as 48 active, 11 delayed |
| White streaks on the left and right | Transaction balls: requests coming in and going out. They turn off automatically when the tile is small (chapter 5) |
| Left sidebar | APDEX · Active Users · Login Users · Error Rate |
| Right sidebar | Apdex Distribution (Satisfied, Tolerating, Frustrated) · TPS · Avg. Response Time |
| Top | LIVE indicator · clock · Fullscreen button · Settings (gear) |
| Bottom | The alert band. Text appears only when there are alert events (chapter 8) |
APDEX expresses the Application Performance Index as a value from 0 to 100. The more requests that respond quickly, the higher it is. The Apdex Distribution on the right uses the same measure to divide requests into Satisfied, Tolerating, and Frustrated counts.
When a tile becomes 1,000px wide or less, or 560px high or less, the left and right sidebars fold away and only the summary under the large number remains. On a 1080p screen they fold from 2 tiles, and on a 4K screen from 8 tiles. Even as the screen gets narrower, the large number and the summary stay to the end, because those two are what must be readable from 3 m away.
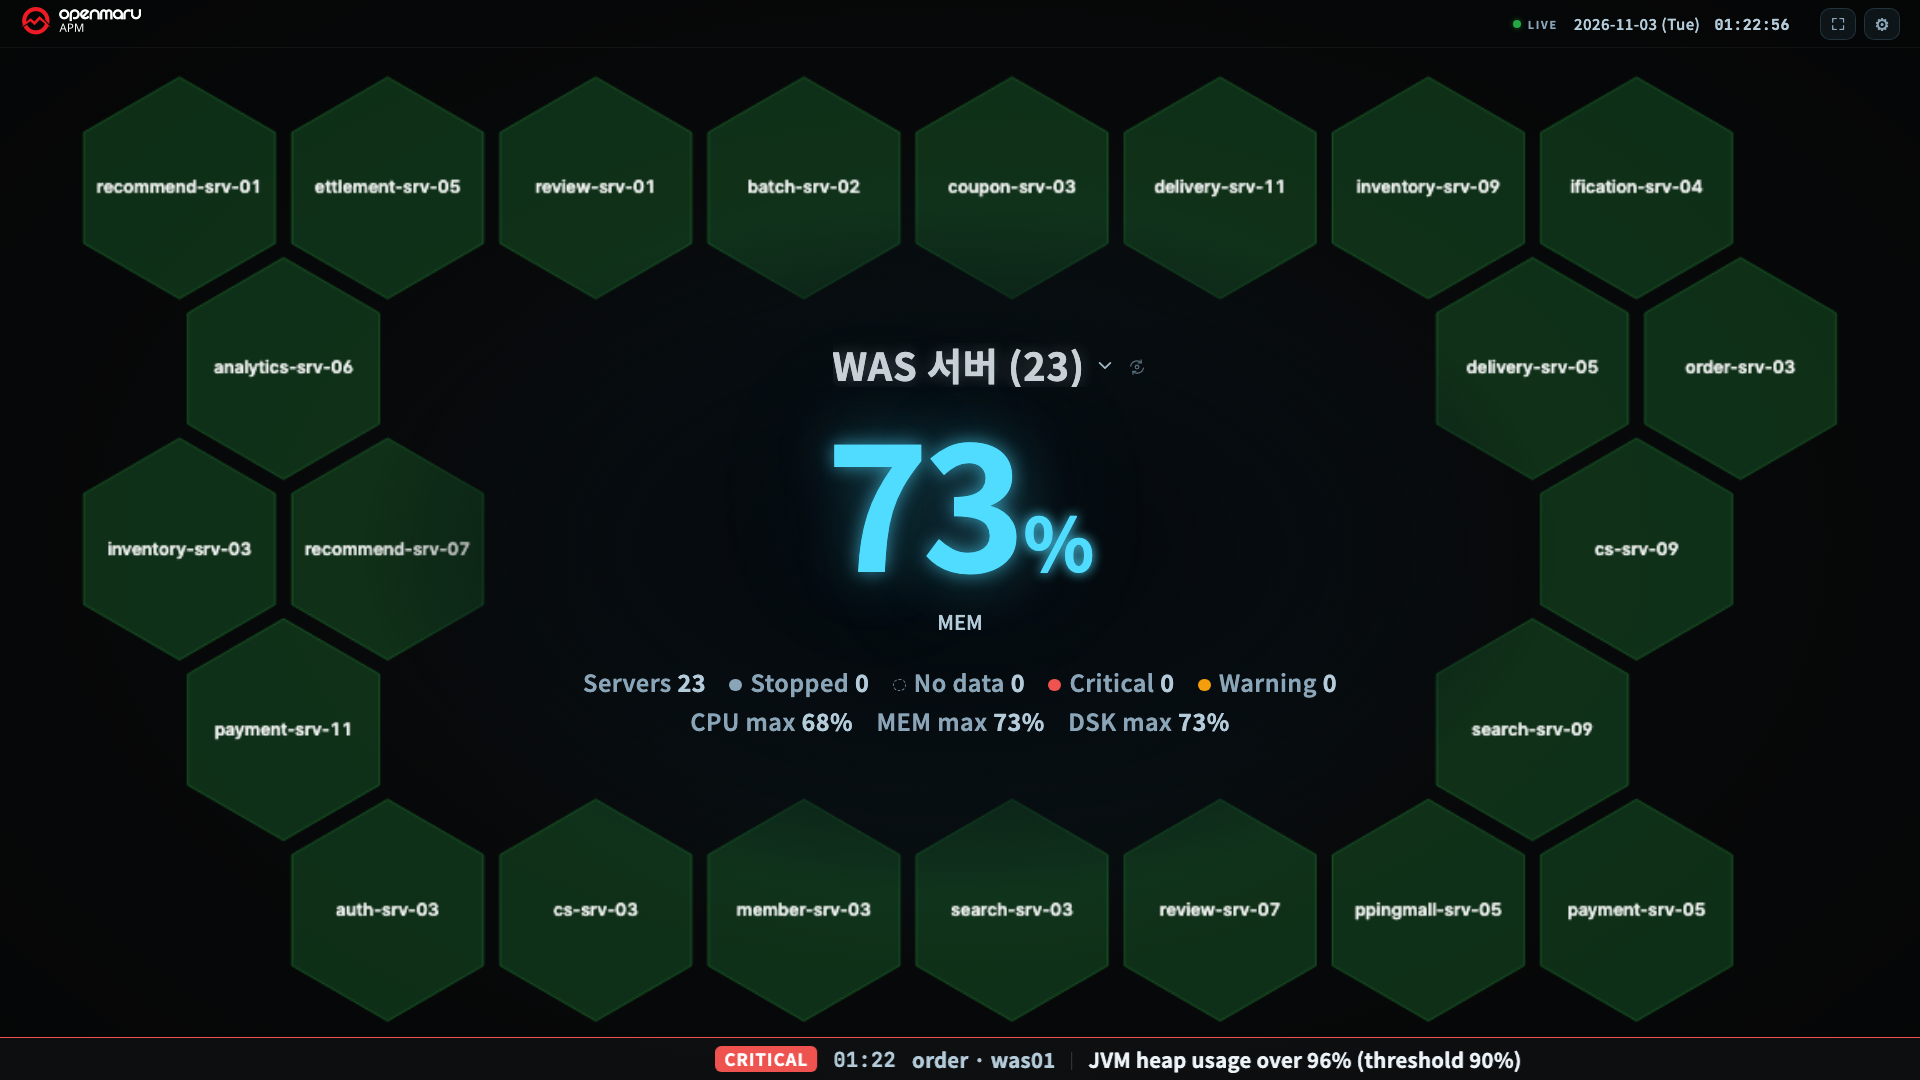
Server view
| Area | What it shows |
|---|---|
| Center (Hive) | Draws each server in the tile as one hexagon |
| Large number | The worst metric value of the worst server in the tile, and the name of that server |
| Summary under the large number | Counts of servers, Stopped, No data, Critical, and Warning, and the maximum value of each metric |
Chapter 7 explains the server view in detail.
Indicators and buttons at the top
| Indicator or button | What it does |
|---|---|
| LIVE indicator | The state of the connection to the APM server. Green is normal; amber means no values have arrived for more than 10 seconds, or the first connection is in progress; red means disconnected. When it is red, click it to reconnect right away (chapter 9) |
| Clock | The current time. The clock also lets you confirm that the screen has not frozen |
| Fullscreen | Switches the browser to fullscreen |
| Settings (gear) | Selects the screen split, view, alert thresholds, visual, and alert band (chapter 10) |
The screen is dark only
The wallboard is always a dark screen. Even if you switch the console theme setting to light, the wallboard stays dark. It is a screen left up on a TV all day, so a bright background easily leaves image retention (burn-in) on the panel, and it is glaring in a dark room.
Display language and names
- It follows the display language (Korean or English) selected in the console.
- If you have set display names (aliases) for groups and instances, the wallboard shows those names too.
On a screen that many people read from a distance, a business name reads better than
prod-order-was-01. Display names are set in chapter H19 of the User Guide.
Copyright (c) 2026. OPENMARU, Inc.