1. Getting Started -- Which One to Use, and Authentication
What This Guide Does
It takes the data APM has gathered and uses it in another system. It is used for showing performance metrics alongside an in-house portal, generating reports automatically, or integrating with another monitoring tool. Almost every graph visible on the console screen can also be received through the API.
All responses are JSON.
Choose First -- JSON API or PromQL
APM provides two integration methods of different character. Chapters 1 to 6 of this guide are one; the PromQL of chapter 7 is the other. They differ in everything from authentication to response format, so decide which one before you start.
In one line -- if you have to change data, use the JSON API; if you have to graph or calculate it, use PromQL.
| JSON API (chapters 1-6) | PromQL (chapter 7) | |
|---|---|---|
| What it can do | Query plus create, update, delete | Query only |
| Authentication | A session cookie (obtained from the login API) | A session cookie works, and the Metric Explorer screen uses an API access key |
| Response format | APM-specific JSON | Standard Prometheus format |
| Specifying the target | The group, IP, and instance are written in the path | Label matchers ({instance_id="…"}) |
| Aggregation | Four functions: mean, sum, max, min | rate, topk, quantile, *_over_time, and others |
| Calculating across series | Not possible -- receive the data and calculate it yourself | Possible inside the query (100 - cpu_idle) |
| Querying configuration | Possible (chapter 2) | Not possible -- metrics only |
| Managing users and permissions | Possible (chapters 4-6) | Not possible |
When to Use the JSON API
- When you have to change settings -- registering users, changing group permissions, managing application groups. PromQL cannot do this.
- When you have to know what is being monitored -- querying the group and instance lists (chapter 2)
- When you want to put a few metrics as numbers on an in-house portal or business system -- you receive one value and use it as it is, so there is no query syntax to learn
- When you want to pull fixed metrics for a fixed period to build a report
What PromQL Is Good For
1. It plugs straight into Grafana. The response is in standard Prometheus format, so entering the APM address into Grafana's Prometheus data source is all it takes. No adapter has to be written, and existing Grafana dashboard assets can be reused as they are. No separate Prometheus server, exporter, or scrape configuration is needed either -- collection, storage, and querying all happen in APM alone.
2. The server does the calculation. Conditions such as "the top 5 instances by GC frequency",
"CPU utilization (= 100 - idle)", and "only instances over 1 GB of heap" are expressed in one
line of query. To do that with the JSON API, the whole data set has to be fetched and the
integration program has to calculate it -- more code, and more data over the wire.
topk(5, rate(jvm_gc_gcCount[5m]))       # top 5 by GC frequency
avg by (instance_id) (jvm_heap_heapUsed) # average heap per instance
100 - cpu_idle                           # CPU utilization
3. Metrics can be found without knowing them. There are APIs for listing metric names and
labels, so what data exists can be explored. The JSON API requires knowing {ns} and {name} in
advance. A Metric Explorer screen for use in a browser is also provided.
4. Labels slice the data. Conditions can be set on labels such as instance_id, ip_addr, and
agent_type to pull only the targets you want and group them by the criteria you want. The JSON API
writes the target in the path, which makes combinations such as "WAS and in a particular group"
difficult.
5. rate and increase are fast and accurate. APM stores the delta at collection time, so a
query only needs a simple sum. The counter-reset correction problem of standard Prometheus does not
arise either.
Put the other way, PromQL is not the answer when you have to change settings (create, update, delete) or need the list of monitored targets. Only the JSON API can do those.
They Are Often Used Together
The two methods are not exclusive. A common combination is receiving the target list through the JSON API to build the screen, and drawing the graphs for those targets with PromQL. Authentication is obtained separately for each.
Authentication for chapters 1 to 6 -- it is not a matter of putting an API key in a header. Call the login API first to receive a session cookie, then send that cookie with every subsequent request.
1) POST /monitoring/api/auth/login   → receive the cookie (__KSMSID__) from the response header
2) GET  /monitoring/api/…            → send the request carrying that cookie
Omit the cookie and a sign-in demand comes back instead of data. When building an integration program, keep the cookie and reuse it, and sign in again when it expires.
How This Guide Is Organized
| Chapter | What it covers |
|---|---|
| Chapter 1 (this one) | The criteria for choosing which to use, and sign-in, authentication, and how to check them |
| Chapter 2 | What is being monitored -- the group and instance lists |
| Chapter 3 | Querying metric data -- the core of this guide |
| 4 to 6 | Managing users, groups, and permissions (not only querying but also creating and changing) |
| Chapter 7 | Querying metrics with standard PromQL -- integration with Grafana and external tools (the authentication method differs) |
The usual order is to get the target names in chapter 2 and query those targets' metrics in chapter 3.
What Is Common to Every API
Response format -- both success and failure report the result in status. It is not the HTTP
status code; look at the status in the body.
{ "status": 200, "result": … }     // success -- the data is in result
{ "status": 401 }                  // sign-in required (cookie missing or expired)
Query APIs put the data in result; create, update, and delete APIs return only { "status": 200 }.
Time notation -- values such as created, firstDate, and registered in this document are all
Unix epoch milliseconds (from 1970-01-01 UTC). They are not seconds, so divide by 1000.
Character handling -- both requests and responses are UTF-8. Without charset=UTF-8 in
Content-Type, non-ASCII names can be corrupted.
No history is kept and the change takes effect immediately. When building an integration program, check with a query first, verify it in a test environment, then move it to production.
This chapter shows how to check sign-in three ways in turn -- with POSTMAN, curl, and a Java library. Read only the one that matches the tool you use.
User Authentication APIs
Login Request Items
Request
| Item | Description |
|---|---|
| URL | /monitoring/api/auth/login |
| HTTP METHOD | POST |
| Content-Type | application/json |
| Parameters | None |
| POST BODY | { "userId": "omadm", "password": "2fefb853a18e46159682c77325379156bd56cd897651cace119a31500381167a" } |
- userId: the user ID
- password: the password hashed with SHA256, hex-encoded, and converted to lower case.
- e.g. use the hash value converted at https://www.xorbin.com/tools/sha256-hash-calculator
Response
| Item | Description |
|---|---|
| Response Body | The content of the response JSON string is as follows. |
| Successful sign-in | { "status": 200, "result": { … } } -- result carries the brand settings for the console |
| Wrong password | { "status": 500, "errorCode": 102020, "reason": "API_AUTH_PASSWORD_MISMATCH_ERROR" } |
Checking Whether You Are Signed In
Request
| Item | Description |
|---|---|
| URL | /monitoring/api/auth/check |
| HTTP METHOD | GET |
| Content-Type | application/json |
| Parameters | None |
Response
| Item | Description |
|---|---|
| Response Body | The content of the response JSON string is as follows. |
| Signed in | { "status": 200 } |
| Not signed in | { "status":500, "errorCode":102050, "reason":"API_AUTH_NOT_LOGIN" } |
Checking the Login API with POSTMAN
Setting the HTTP Method, URL, and Content-Type for Authentication
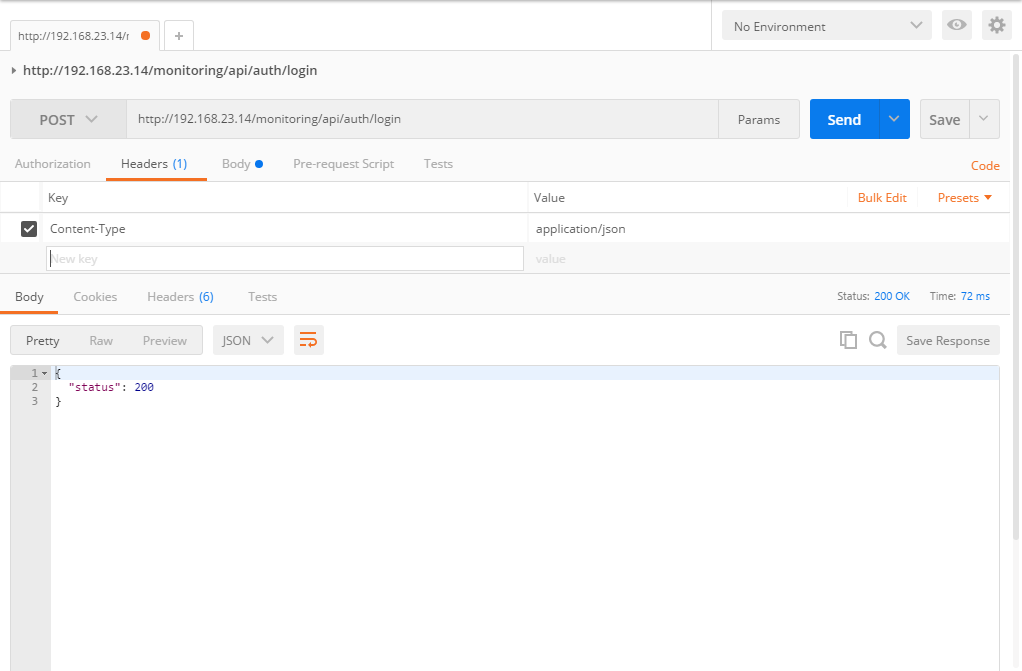
Set POST and the URL Set the Content-Type
Entering the User Details for Sign-in
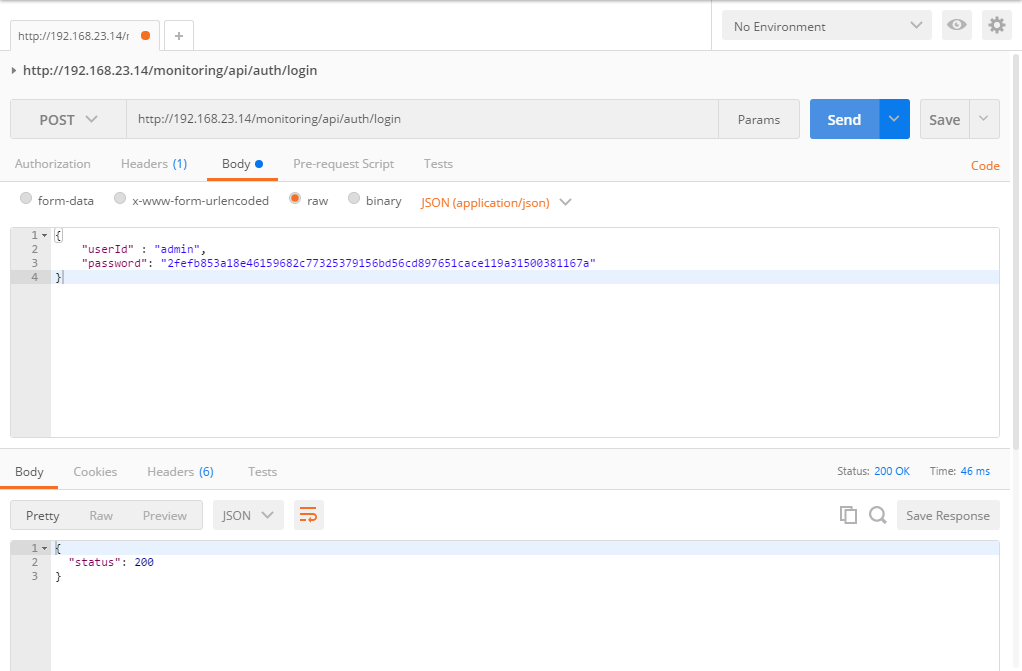
Set the POST body
Sending the Login Request and Checking the Result
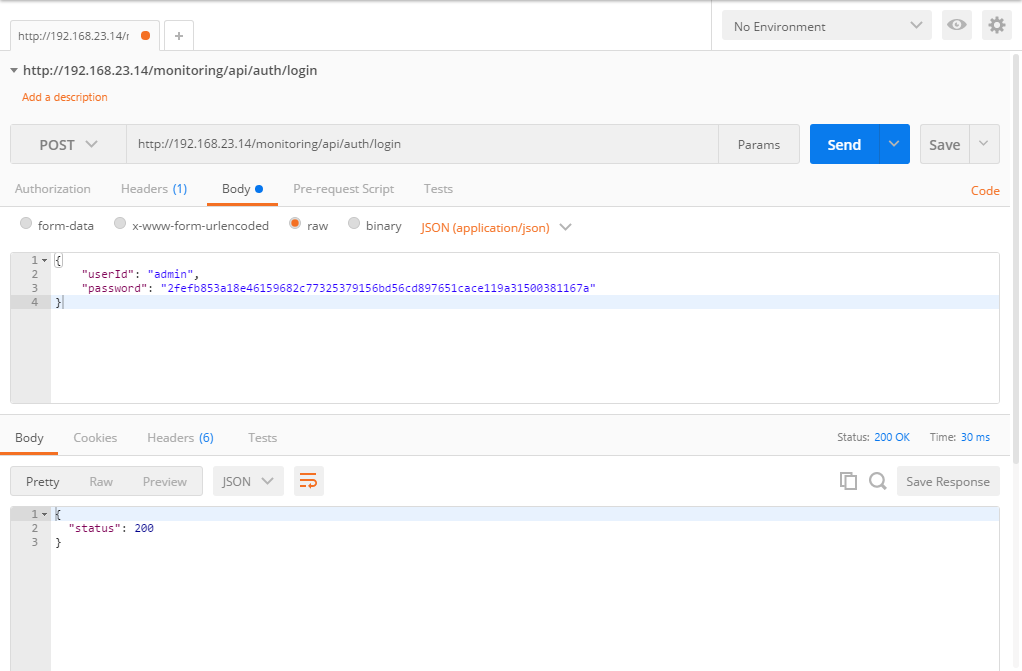
Check the response Click 'Send'.
Setting the URL for the Sign-in Check, Then Checking the Request and Response
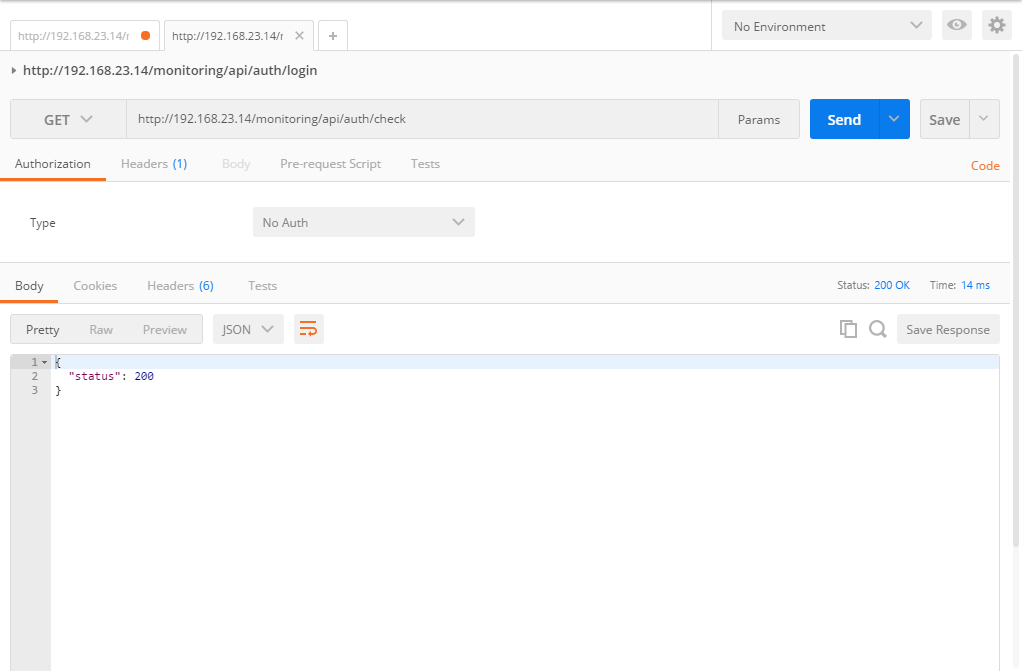
Set the URL and click Send Check the response
Checking the Login API with CURL
Login Request and Response
$ curl -i -H "Content-Type: application/json" \
    -d '{"userId": "omadm", "password": "2fefb853a18e46159682c77325379156bd56cd897651cace119a31500381167a"}' \
    http://192.168.23.190/monitoring/api/auth/login

HTTP/1.1 200
Set-Cookie: __KSMSID__=05908742-bb0d-473b-90c1-f8d8413d7d5a;Path=/;HttpOnly
Set-Cookie: OMAPMJSESSIONID=BFAAC2FBFE828AF883F4A5A73AB8D681.khan11; Path=/monitoring; HttpOnly
Set-Cookie: KHANUSER=x3u6los95jgltq; Path=/; Max-Age=2147483647
Content-Type: application/json;charset=UTF-8
Content-Length: 352

{"status":200,"result":{"brandConfig":{ … },"start.page":""}}
Among the Set-Cookie entries in the response header, __KSMSID__ is the session cookie (two
underscores on each side). This value has to be sent with the next API request for it to be
processed. The other cookies (OMAPMJSESSIONID and KHANUSER) are not used for integration.
The result in the body also carries the brand settings the console screen uses. An integration
program only needs to look at the status value.
Sign-in Check Request and Response
The sign-in check API below is processed only when the cookie received from the login request is set on the request.
- When signed in
$ curl -i --cookie "__KSMSID__=05908742-bb0d-473b-90c1-f8d8413d7d5a" \
    -H "Content-Type: application/json" \
    http://192.168.23.190/monitoring/api/auth/check

HTTP/1.1 200
Content-Type: application/json;charset=UTF-8
Content-Length: 14

{"status":200}
- When not signed in
$ curl -i -H "Content-Type: application/json" \
    http://192.168.23.190/monitoring/api/auth/check

HTTP/1.1 500
Content-Type: application/json;charset=UTF-8
Content-Length: 63

{"status":500,"errorCode":102050,"reason":"API_AUTH_NOT_LOGIN"}
Signing In with an HTTP Client Library
Specifying the Maven Dependency
To integrate using the Apache Commons HTTP Client module, specify the dependency in the Maven pom.xml file as follows.
<dependency>
  <groupId>org.apache.httpcomponents</groupId>
  <artifactId>httpclient</artifactId>
  <version>4.4.1</version>
</dependency>
Example Sign-in Code
Below is short example code for signing in and checking the sign-in state using the HttpClient module.
The point to note is that a BasicCookieStore is set on the HttpClient object so the cookie from the login response keeps being used.
package test;

import org.apache.http.HttpResponse;
import org.apache.http.client.methods.HttpGet;
import org.apache.http.client.methods.HttpPost;
import org.apache.http.entity.ContentType;
import org.apache.http.entity.StringEntity;
import org.apache.http.impl.client.BasicCookieStore;
import org.apache.http.impl.client.DefaultHttpClient;

import java.io.BufferedReader;
import java.io.InputStreamReader;

public class TestHttpClientCookie {

    public static void main(String args[]) throws Exception {
        String LOGIN_JSON_STRING = "{\n" +
                "\t\"userId\": \"omadm\", \n" +
                "\t\"password\": \"2fefb853a18e46159682c77325379156bd56cd897651cace119a31500381167a\"\n" +
                "}";

        // Cookie Store
        BasicCookieStore cookieStore = new BasicCookieStore();

        DefaultHttpClient client = new DefaultHttpClient();
        client.setCookieStore(cookieStore);

        // HTTP POST Login
        HttpPost httpLoginPost = new HttpPost("http://192.168.23.14/monitoring/api/auth/login");

        StringEntity requestEntity = new StringEntity(
                LOGIN_JSON_STRING,
                ContentType.APPLICATION_JSON);

        httpLoginPost.setEntity(requestEntity);

        HttpResponse loginResponse = client.execute(httpLoginPost);
        System.out.println("Send Login Request");

        if (loginResponse.getStatusLine().getStatusCode() != 200) {
            throw new RuntimeException("Failed : HTTP error code : "
                    + loginResponse.getStatusLine().getStatusCode());
        }

        BufferedReader loginBufferedReader = new BufferedReader(
                new InputStreamReader((loginResponse.getEntity().getContent())));

        String loginOutput;
        System.out.println("Login Result from Server ....");
        while ((loginOutput = loginBufferedReader.readLine()) != null) {
            System.out.println(loginOutput);
        }

        HttpGet checkRequest = new HttpGet("http://192.168.23.14/monitoring/api/auth/check");
        checkRequest.setHeader("Content-Type", "application/json");

        HttpResponse checkResponse = client.execute(checkRequest);
        System.out.println("Send Login Check Request");

        if (checkResponse.getStatusLine().getStatusCode() != 200) {
            throw new RuntimeException("Failed : HTTP error code : "
                    + checkResponse.getStatusLine().getStatusCode());
        }

        BufferedReader checkBufferedReader = new BufferedReader(
                new InputStreamReader((checkResponse.getEntity().getContent())));

        String checkOutput;
        System.out.println("Login Check Result from Server .... ");
        while ((checkOutput = checkBufferedReader.readLine()) != null) {
            System.out.println(checkOutput);
        }

    }
}
Execution Result
The result of running the example code is as follows.
Send Login Request
Login Result from Server ....
{"status":200}
Send Login Check Request
Login Check Result from Server ....
{"status":200}
Health Check
It checks whether the APM server is alive. It is the only API that can be called without signing in, so it is used as the health-check target for a load balancer or monitoring tool.
When healthy it returns {"status": 200}.
| Item | Description |
|---|---|
| URL | /monitoring/api/check/healthCheck |
| Example request URL | /monitoring/api/check/healthCheck |
| HTTP METHOD | GET |
| Content-Type | application/json; charset=UTF-8 |
| Body | |
| Response | {"status": 200} |