5.1. Troubleshooting Guide
Failure Checklist
When a failure occurs, checking in the following order is recommended.
- Determine the scope of impact: whether the whole cluster has failed, or a particular node, namespace, or application
- Check node state: carry out the Checking Node State procedure
- Check the state of the core cluster components: the API server, etcd, CoreDNS, and so on
- Check recent changes: whether there has been a recent deployment, configuration change, or upgrade
- Check logs and events: the logs of the pods involved, and the cluster events
- Check the MSAP Observability dashboards: narrow the range of causes from the metric trends
- Contact the technical support team if needed
Checking Node State
# Check the state of all nodes
kubectl get nodes -o wide

# Details of a particular node (conditions, allocated resources, and so on)
kubectl describe node <node-name>

# Check the node service state (run directly on each node)
systemctl status rke2-server   # Master
systemctl status rke2-agent    # Worker

# Check the kubelet state
systemctl status kubelet
Node NotReady
- Check the conditions (MemoryPressure, DiskPressure, PIDPressure, Ready) with
kubectl describe node <node-name> - Connect to the node over SSH and check
systemctl status rke2-server(orrke2-agent) - Check whether disk or memory is short (see Handling Failures by Component)
- Restart the service if needed
systemctl restart rke2-agent # for a Worker node
Checking Cluster Component State
OPENMARU COP is based on RKE2, so component health is judged from the state of the system services and the core pods.
# Whether the API server is reachable
kubectl get --raw='/readyz?verbose'

# Check the API server listening port (on a Master node)
ss -tlnp | grep 6443

# etcd cluster state (on a Master node, running etcdctl inside the etcd static pod)
# The host has no etcdctl binary, so run it inside the etcd pod with kubectl exec.
kubectl exec -n kube-system etcd-<master-node> -- etcdctl \
  --endpoints=https://127.0.0.1:2379 \
  --cacert=/var/lib/rancher/rke2/server/tls/etcd/server-ca.crt \
  --cert=/var/lib/rancher/rke2/server/tls/etcd/server-client.crt \
  --key=/var/lib/rancher/rke2/server/tls/etcd/server-client.key \
  endpoint status --cluster -w table

# Check the CoreDNS state
kubectl get pods -n kube-system -l k8s-app=kube-dns
kubectl run -it --rm debug -n kube-system --image=busybox --restart=Never -- nslookup kubernetes.default

# List unhealthy pods across all namespaces
kubectl get pods -A | grep -v Running

# Check recent cluster events
kubectl get events -A --sort-by='.lastTimestamp' | tail -20
Checking Node Logs
# The RKE2 service log (Master)
journalctl -u rke2-server -f

# The RKE2 service log (Worker)
journalctl -u rke2-agent -f

# Check node resource pressure from pod events
kubectl get events --field-selector reason=Evicted -A

# Check disk usage and clean up unused images
df -h
crictl rmi --prune
journalctl --vacuum-size=1G
Checking the Web Console Dashboard
Check the following first on the main dashboard of the OPENMARU COP Console.
- The node state doughnut chart: whether there are NotReady nodes
- The pod state doughnut chart: the proportion of pods in Pending/CrashLoopBackOff/Error
- The recent event list: events at warning level
- The CPU/memory gauges: whether resources are exhausted
When the console itself cannot be reached (a 502 or 504 error), also check Handling Failures by Component - Ingress 502/503.
Handling Failures by Component
| Symptom | What to check | Resolution |
|---|---|---|
| No communication between pods | The state of the CNI (Canal/Calico) pods, the VXLAN port (4789) | Restart the CNI pods, check the VXLAN port in the firewall and security groups |
| A service is unreachable | Whether endpoints exist, the kube-proxy state | Check the backend pod connection with kubectl get endpoints |
| No external communication | DNS, NAT, the firewall | Check the node routing table and the firewall policy |
| A PVC stays Pending | The storage class, the NFS Provisioner state | Check the events with kubectl describe pvc; check whether the NFS mount is possible with showmount -e <nfs-server> |
| An NFS mount fails (access denied) | The /etc/exports configuration, the firewall | Check the allowed IP ranges on the NFS server |
| A PV is stuck in Terminating | The finalizer | kubectl patch pv <name> -p '{"metadata":{"finalizers":null}}' (⚠️ whether the storage is actually deleted has to be confirmed separately) |
| Ingress 502/503 | The backend pod state, the readiness probe | Check whether the target pod is Ready |
| A TLS certificate error | Whether the secret exists, its expiry date | kubectl get secret <tls-secret> -n <ns> -o yaml, check the cert-manager renewal state |
| ImagePullBackOff | The ImagePullSecret, registry reachability | Check the exact error message in the events from kubectl describe pod |
| CrashLoopBackOff | The application log | Check the cause of the previous exit with kubectl logs <pod> --previous |
| OOMKilled | The memory limit | Confirm OOMKilled in kubectl describe pod and raise resources.limits.memory |
| A pod stays Pending (cannot be scheduled) | Taints and tolerations, the node selector, insufficient resources | Check the reason for the scheduling failure in the Events of kubectl describe pod |
| Node MemoryPressure | Excessive node memory usage | See Handling a Memory Shortage (MemoryPressure) below |
Handling a Memory Shortage (MemoryPressure)
# 1. Check the node memory usage
free -h

# 2. List pods sorted by memory usage (across the cluster)
kubectl top pod -A --sort-by=memory

# 3. Check the memory limit configured per pod
kubectl get pods -A -o custom-columns=\
'NAME:.metadata.name,MEM:.spec.containers[*].resources.limits.memory'

# 4. Clean up unnecessary pods and pods holding excessive memory
kubectl delete pod <pod-name> -n <namespace>
When a node enters MemoryPressure, Kubernetes can automatically evict pods, starting with the lowest priority. Check the list of evicted pods as follows.
kubectl get events --field-selector reason=Evicted -A
Handling Failures by Service
| Service | Typical symptom | Action |
|---|---|---|
| GitLab | The service fails to start | docker exec -it gitlab gitlab-ctl reconfigure, and gitlab-ctl restart if needed |
| GitLab | A 500 error | Rerun the Rails cache and database migration |
| GitLab | Git push/pull fails (Permission denied, Unable to create temporary file) | Check the disk space with docker exec -it gitlab df -h; if short, clean up with gitlab-rake gitlab:cleanup:orphan_job_artifact_files; for a permission problem, chown -R git:git /var/opt/gitlab/git-data/repositories/ |
| Jenkins | A build fails (DinD/Kaniko) | Check the build agent pod log and the PVC mount state |
| Harbor | Push/pull fails | Retry docker login; check the containerd registry trust configuration on the node (the registry.{sub_domain}.{domain}.{TLD}:8443 entry and the insecure_skip_verify value in /etc/rancher/rke2/registries.yaml) |
| Harbor | A vulnerability scan fails | Check whether the Trivy database is up to date |
| ArgoCD | Sign-in fails | Sign in again with the value of argocd-initial-admin-secret |
| ArgoCD | Synchronization fails | Reconnect the repository and force a synchronization (argocd app sync <app> --force) |
| Keycloak | SSO sign-in fails | Check the client redirect URI configuration |
| Keycloak | LDAP integration fails | Check the LLDAP service state and the network connection |
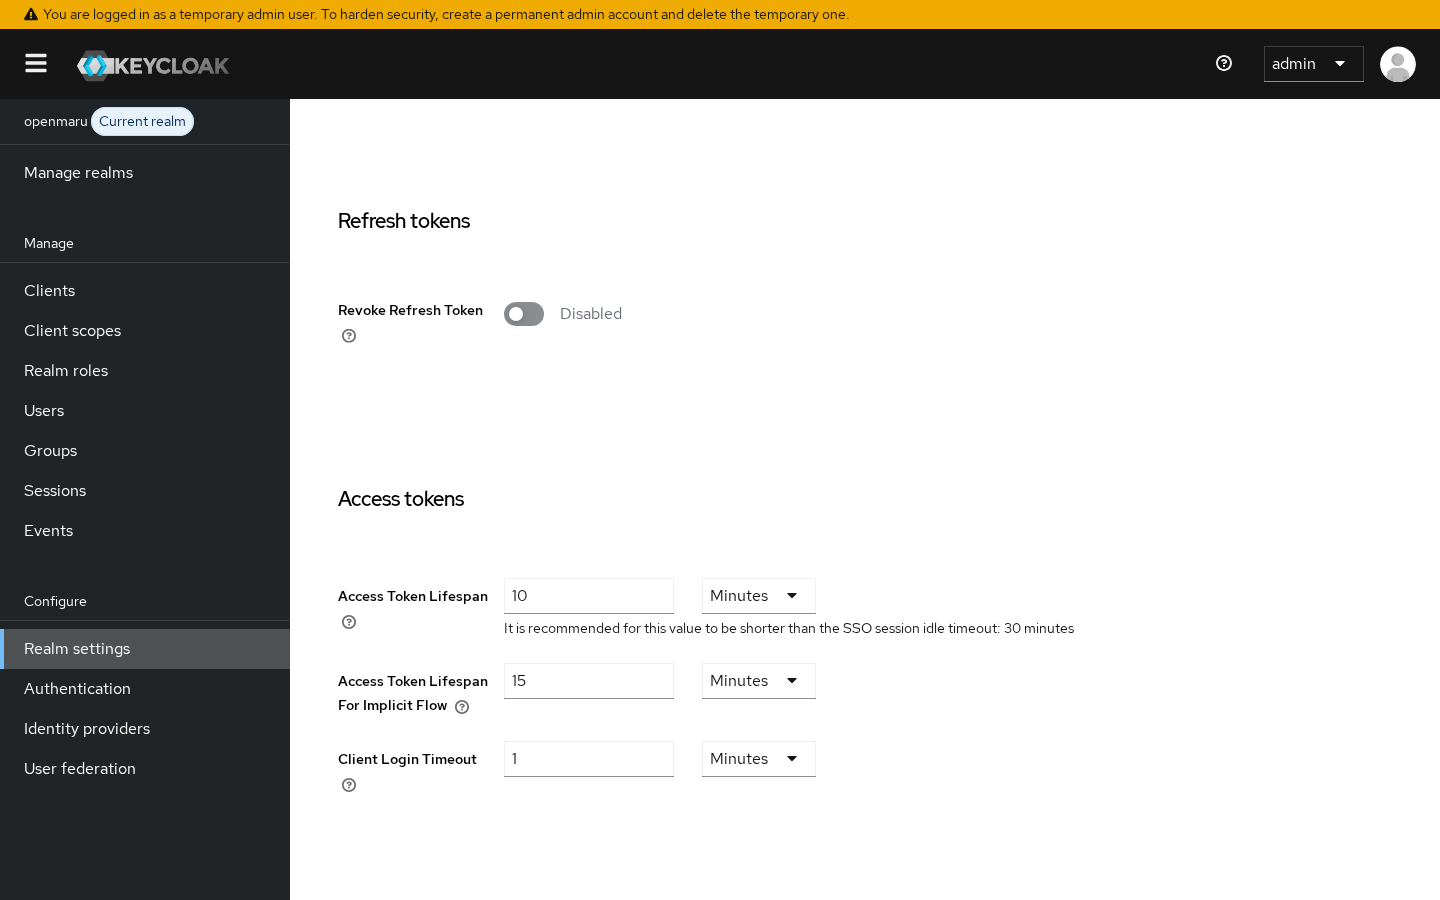
| Keycloak | Token or session expiry (Token expired, Session has expired) | Extend the Access Token Lifespan and SSO Session Max under Realm Settings > Tokens in the Keycloak Admin Console, or adjust them from the CLI with kcadm.sh update realms/openmaru -s accessTokenLifespan=1800 -s ssoSessionMaxLifespan=86400 |
| OPENMARU COP Console | Unreachable (502) | Check the Console pod and Ingress state |
| OPENMARU COP Console | Connection to the cluster fails | Check the validity of the RBAC and ServiceAccount token |
| MSAP Observability | Logs are not collected | Check the Fluent Bit DaemonSet state with kubectl get pods -n openmaru-logging -l app.kubernetes.io/name=fluent-bit; check the OpenTelemetry Collector state (kubectl get pods -n openmaru-observ -l app.kubernetes.io/name=openmaru-observ-otel-collector) and its health check (wget -qO- http://localhost:13133/health) |
| MSAP Observability | A dashboard does not load, or a data source error | Check the state of all pods with kubectl get pods -n openmaru-observ; check ClickHouse (-l app.kubernetes.io/name=openmaru-observ-clickhouse) and, if needed, kubectl rollout restart statefulset/openmaru-observ-server -n openmaru-observ |
Keycloak token and session expiry - the Console screen: In the Keycloak Admin Console, select the target realm (openmaru) and check or extend the Access Token Lifespan value on the Realm settings > Tokens tab. (SSO Session Max is on the Sessions tab of the same screen.)
Handling GPU Failures
These are the failures that occur in an environment with GPU nodes, and what to do about them.
Actions by Symptom
| Symptom | Cause | Action |
|---|---|---|
A GPU pod stays Pending | The device is already held by another workload | Check what is holding it with kubectl get resourceclaims -A. If the aim is sharing, change it to reference the ResourceClaim by name |
A GPU pod stays Pending with cannot allocate all claims | Device partitioning is off, so one claim holds the whole device | Check the device's allowMultipleAllocations and the cluster feature gate |
The pod is Running but GPU computation fails | The device was not injected into the container | Check nvidia-smi -L inside the pod. If the list is empty, check the driver and device injection configuration |
| A workload terminates suddenly | Another workload on the same GPU used all the memory | GPU memory is not physically divided. Rebalance the total memory of the workloads running together |
| The node does not show a GPU | A problem with the driver or the GPU Operator | Check the state of the components with kubectl get pods -n gpu-operator |
The device list (resourceslices) is empty | A problem with the DRA driver | Check the kubelet plugin state with kubectl get pods -n nvidia-dra-driver-gpu |
A Problem with the DRA Driver kubelet Plugin
This is the case where, after raising the driver version, the plugin is in CrashLoopBackOff and the log shows the following.
Error: error creating driver: unable to get checkpoint: checkpoint is corrupted
The checkpoint file left by the previous version is not compatible with the new one. It happens only on that node; nodes with no record of device allocation are unaffected.
Caution: When the plugin does not work, pods that were using the GPU get stuck in
Terminating. There is nothing left to clean the device up.
# 1) Empty the GPU workloads from that node
kubectl scale deploy -n <namespace> <workload> --replicas=0

# 2) Back up the checkpoint and delete it
ssh root@<node> 'cp -a /var/lib/kubelet/plugins/gpu.nvidia.com/checkpoint.json \
  /tmp/checkpoint.json.bak-$(date +%H%M%S) && \
  rm -f /var/lib/kubelet/plugins/gpu.nvidia.com/checkpoint.json'

# 3) Recreate the plugin pod
kubectl delete pod -n nvidia-dra-driver-gpu \
  -l app.kubernetes.io/name=dra-driver-nvidia-gpu \
  --field-selector spec.nodeName=<node>

# 4) Restore the workload
kubectl scale deploy -n <namespace> <workload> --replicas=1
Note: On clusters installed in image mode (
node_os_mode: bootc), the node login account iscop. Runssh cop@<node> 'sudo ...'instead ofssh root@<node>above. Direct root login is blocked once installation completes.
When Time-slicing Configuration Is Left Behind
Even after time-slicing is turned off, the configuration can remain in three places and keep working. The GPU Operator installation script checks for this and reports it, and the cleanup order has to be kept.
Caution: Deleting the ConfigMap first leaves a volume reference in the DaemonSet and the pod cannot start (
MountVolume.SetUp failed). Empty the ClusterPolicy first.
kubectl patch clusterpolicy cluster-policy --type=merge \
  -p '{"spec":{"devicePlugin":{"config":{"name":"","default":""}}}}'
kubectl label node <node> nvidia.com/device-plugin.config-
kubectl delete cm time-slicing-config-all -n gpu-operator
kubectl rollout restart ds/nvidia-device-plugin-daemonset ds/gpu-feature-discovery -n gpu-operator
Caution: After the cleanup, the GPU count the node advertises drops, so some of the pods that were using that GPU become
Pending. Check the workloads before doing this and secure a maintenance window.
Restoring from a Master Backup (etcd)
OPENMARU COP backs up and restores the cluster state (all Kubernetes resource definitions) through etcd snapshots.
Creating a Snapshot (Scheduled Backup)
rke2 etcd-snapshot save --name <snapshot-name>

# List the saved snapshots
rke2 etcd-snapshot ls
ℹ️ Note: The scheduled backup can be automated at installation time through the backup-related settings in
env.yaml.
Restoring from a Snapshot
🚨 Warning: This work returns the entire cluster state to the moment of the snapshot and cannot be undone. Always create an additional snapshot of the current state before proceeding.
-
Stop the RKE2 service on the Master node to be restored
systemctl stop rke2-server -
Rebuild the cluster from the snapshot
rke2 server --cluster-reset --cluster-reset-restore-path=<snapshot-path> -
Restart the RKE2 service
systemctl start rke2-server -
Check whether the remaining Master nodes have to rejoin the cluster (usually they rejoin after their data directory is cleared)
-
Verify after the restore
kubectl get nodes -o widekubectl get pods -A | grep -v Running
⚠️ Caution:
--cluster-resetis a last resort. Where possible, first try to bring things back with the Node NotReady and Checking Cluster Component State procedures, and carry out the etcd restore only when recovery is impossible. Discussing it with the technical support team before starting is recommended.