3.3. Tools for Viewing MBeans
Because the product follows the JMX standard, you can choose whichever tool you prefer. Pick the one that fits your purpose.
| Tool | When to use it | What it needs |
|---|---|---|
| JConsole | For a quick look at a value. Included with the JDK, so nothing to install | JDK |
| VisualVM | To view heap and threads alongside the values | Separate install (unbundled from JDK 9 onward) |
| hawtio | To view from a web browser. Convenient for remote servers | Jolokia must be deployed |
| jmxterm | To extract values from the command line in a script | Separate install |
| Prometheus JMX Exporter | To collect values continuously and keep them as graphs | Agent configuration |
| WAS administration console | If a product console such as WebLogic or JEUS has a JMX browser, use that | None |
For continuous monitoring, we recommend a collecting tool such as Prometheus JMX Exporter; for a one-time look, JConsole.
Viewing With JConsole
On a machine with the JDK installed, run the following, select the WAS process from the list, and expand com.opennaru.khan.session on the MBeans tab.
jconsole
For a remote server, the WAS startup options need JMX remote access settings.
-Dcom.sun.management.jmxremote
-Dcom.sun.management.jmxremote.port=9999
-Dcom.sun.management.jmxremote.authenticate=false
-Dcom.sun.management.jmxremote.ssl=false
Opening it without authentication lets anyone connect. In production, turn on authentication and SSL, or restrict access with a firewall.
Viewing From a Browser (hawtio Example)
This is how to view a remote server's MBeans from a web browser. The screens below were captured with hawtio, but the values and operations you see are the same whichever tool you use.
Jolokia must be deployed on the server side. Jolokia is a bridge that exposes JMX over HTTP, and browser-based tools read MBeans through it.
Once that is ready, connect from the browser by entering the server address and connection details. For JBoss, use the server's IP address, the HTTP port, and a management console account.
Checking That Jolokia Is Deployed
If you cannot connect, first check whether Jolokia is deployed. For JBoss, standalone-ha.xml must contain the following.
<deployments>
    ...
    <deployment name="jolokia-war-1.2.0.war" runtime-name="jolokia-war-1.2.0.war">
        <content sha1="ea788aa20046173561f736ae738113c4d8ff6133"/>
    </deployment>
    ...
</deployments>
If it is not configured, configure it as follows using jolokia-1.2.0.war.
<deployments>
    ...
    <deployment name="jolokia-war-1.2.0.war" runtime-name="jolokia-war-1.2.0.war">
        <fs-archive path="/svc/test/domains/app/jolokia-war-1.2.0.war"/>
    </deployment>
    ...
</deployments>
Checking Session Information
- Monitoring session state
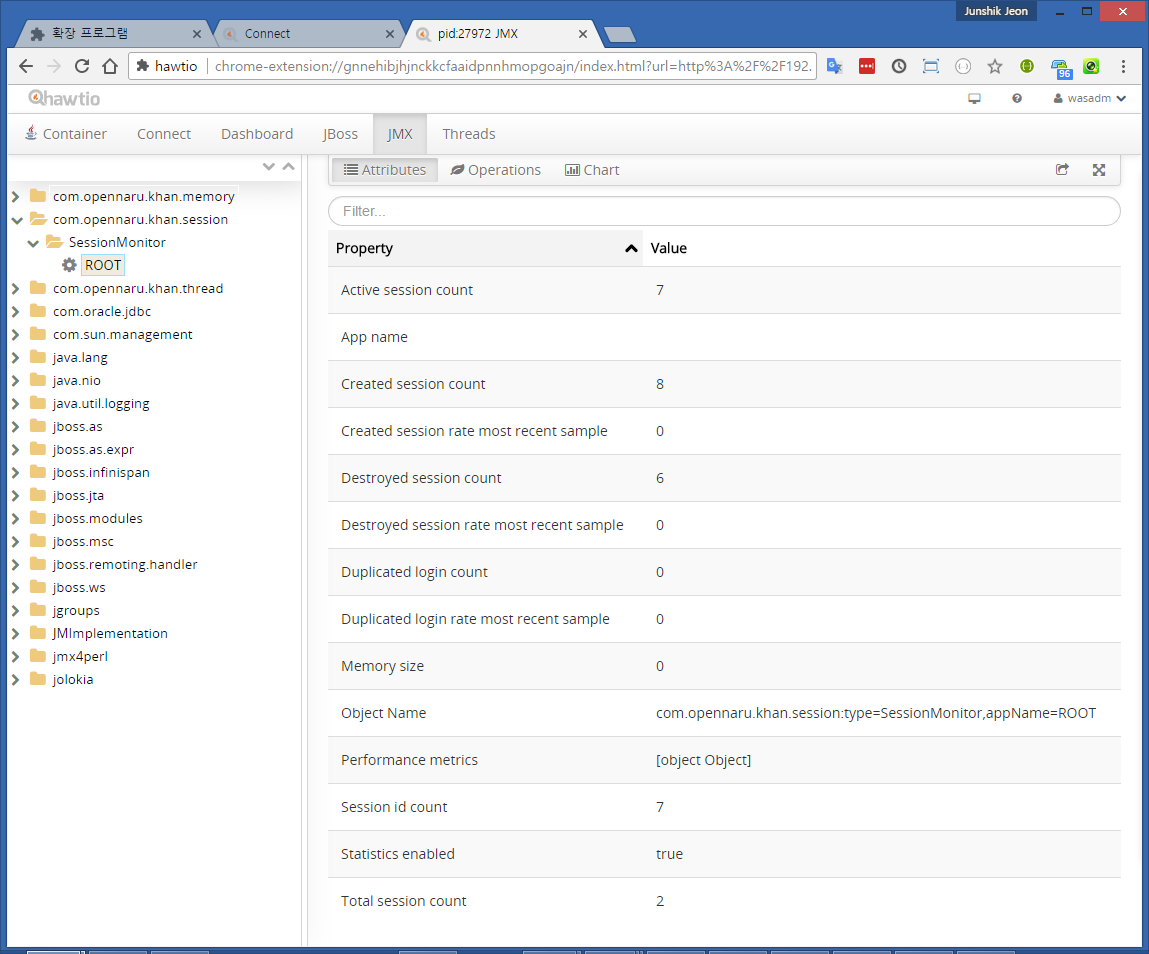
Expand com.opennaru.khan.session in the MBean list and click the application name (ROOT for the root context) to see the session information.
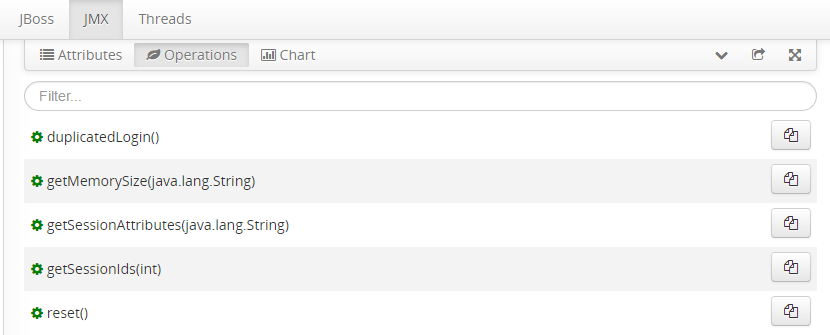
- Selecting the 'Operations' tab
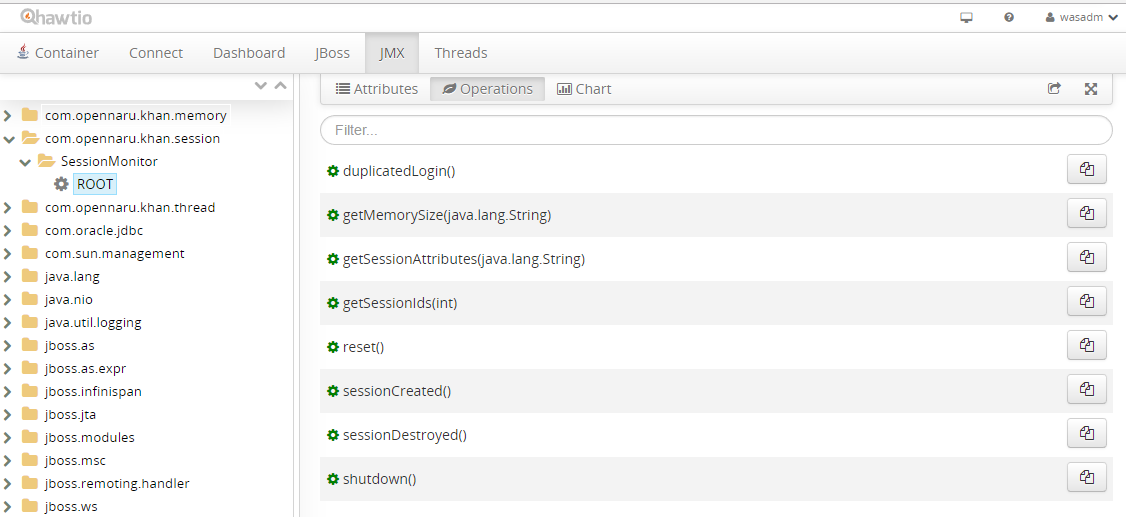
Selecting the Operations tab shows the APIs that can retrieve information.
- Retrieving the list of session IDs
Click 'getSessionIds(int)'.
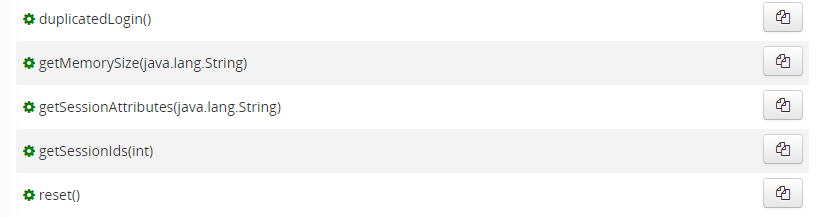
Enter the number of session IDs to retrieve as the parameter, then click the 'Execute' button.
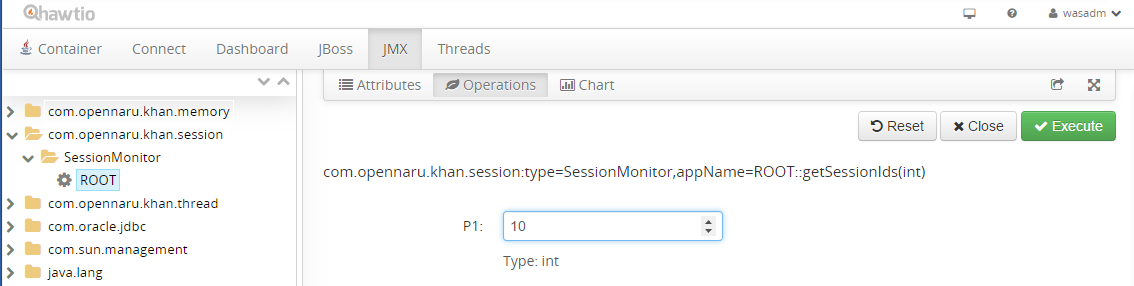
The session IDs currently in use are shown as below.
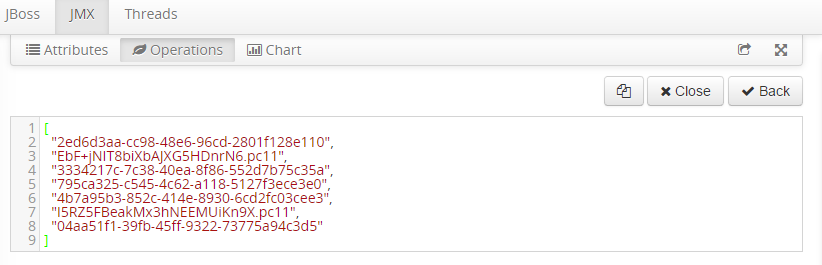
- Showing the attributes for a session ID
- Click getSessionAttributes(java.lang.String).
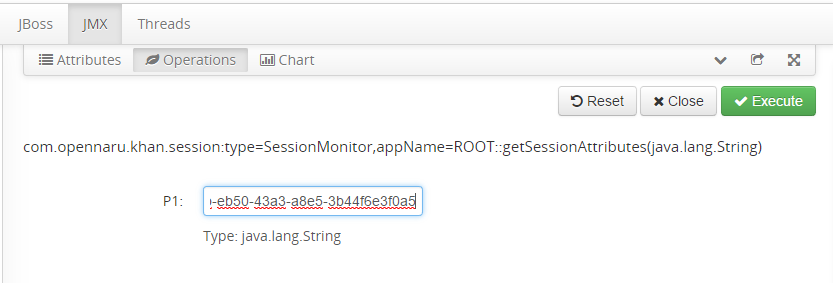
- Enter the session ID in P1, then click the 'Execute' button.
- The session ID among the cookies,
__KSMSID__by default
- The session ID among the cookies,
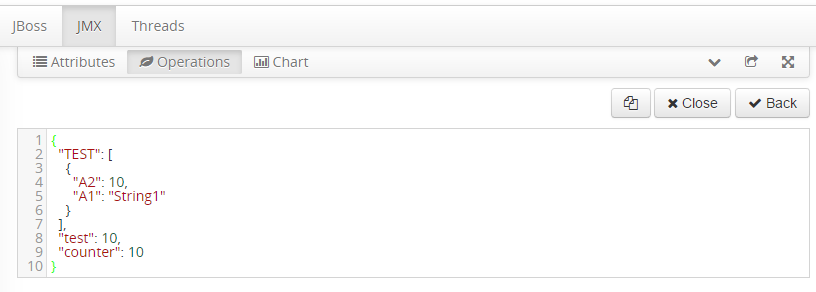
- Check the session information.
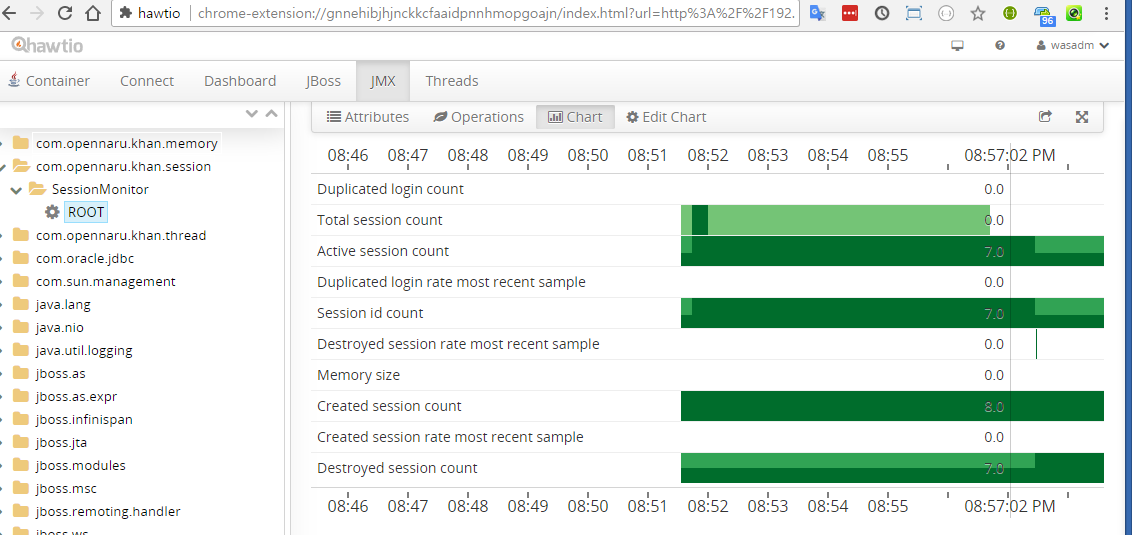
Viewing Trends on a Chart
You can see how session information changes over time. Knowing the shape of the normal values lets you notice anomalies right away.