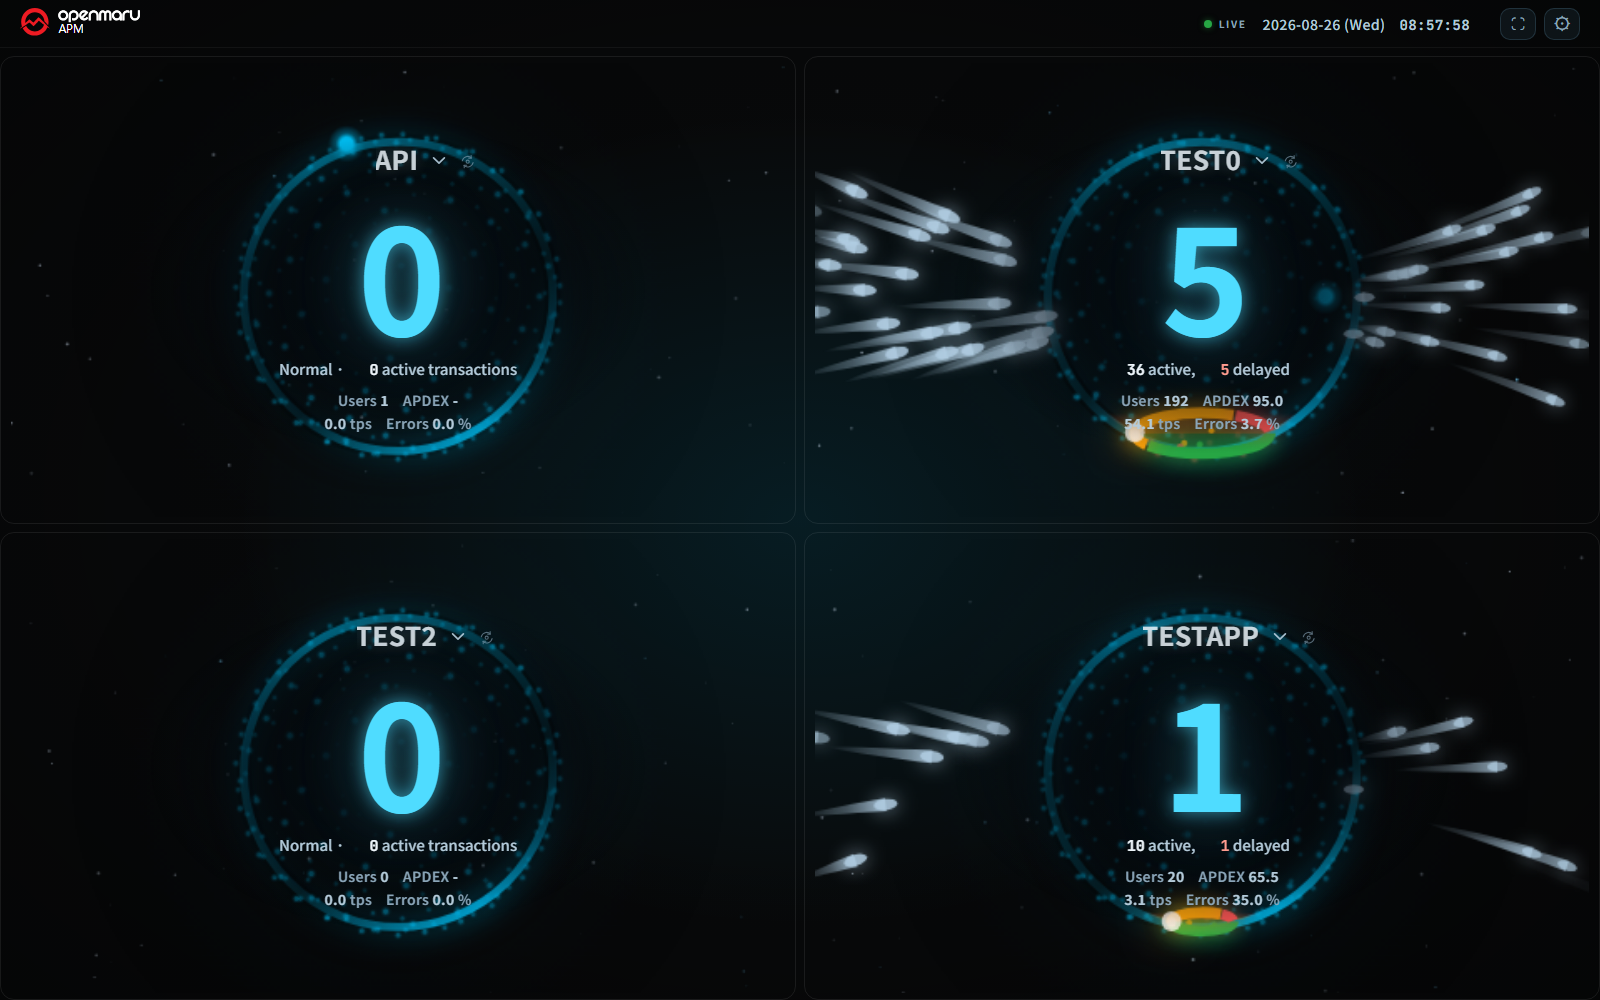
TV Wallboard — Several Services on One Large Screen
Splits the screen into 2–8 panes and assigns a different application group to each, so you can watch several services at once. The number of panes and the group in each can be chosen in settings or specified in advance via the URL
Conveys anomalies through per-group motion (speed, size, and regularity) as well as color
Logging out stops and locks the screen on its own; the screen keeps its last state when the connection drops and resumes once reconnected, and rendering quality is lowered automatically on low-spec PCs
Location: Top bar of the console → TV Wallboard button
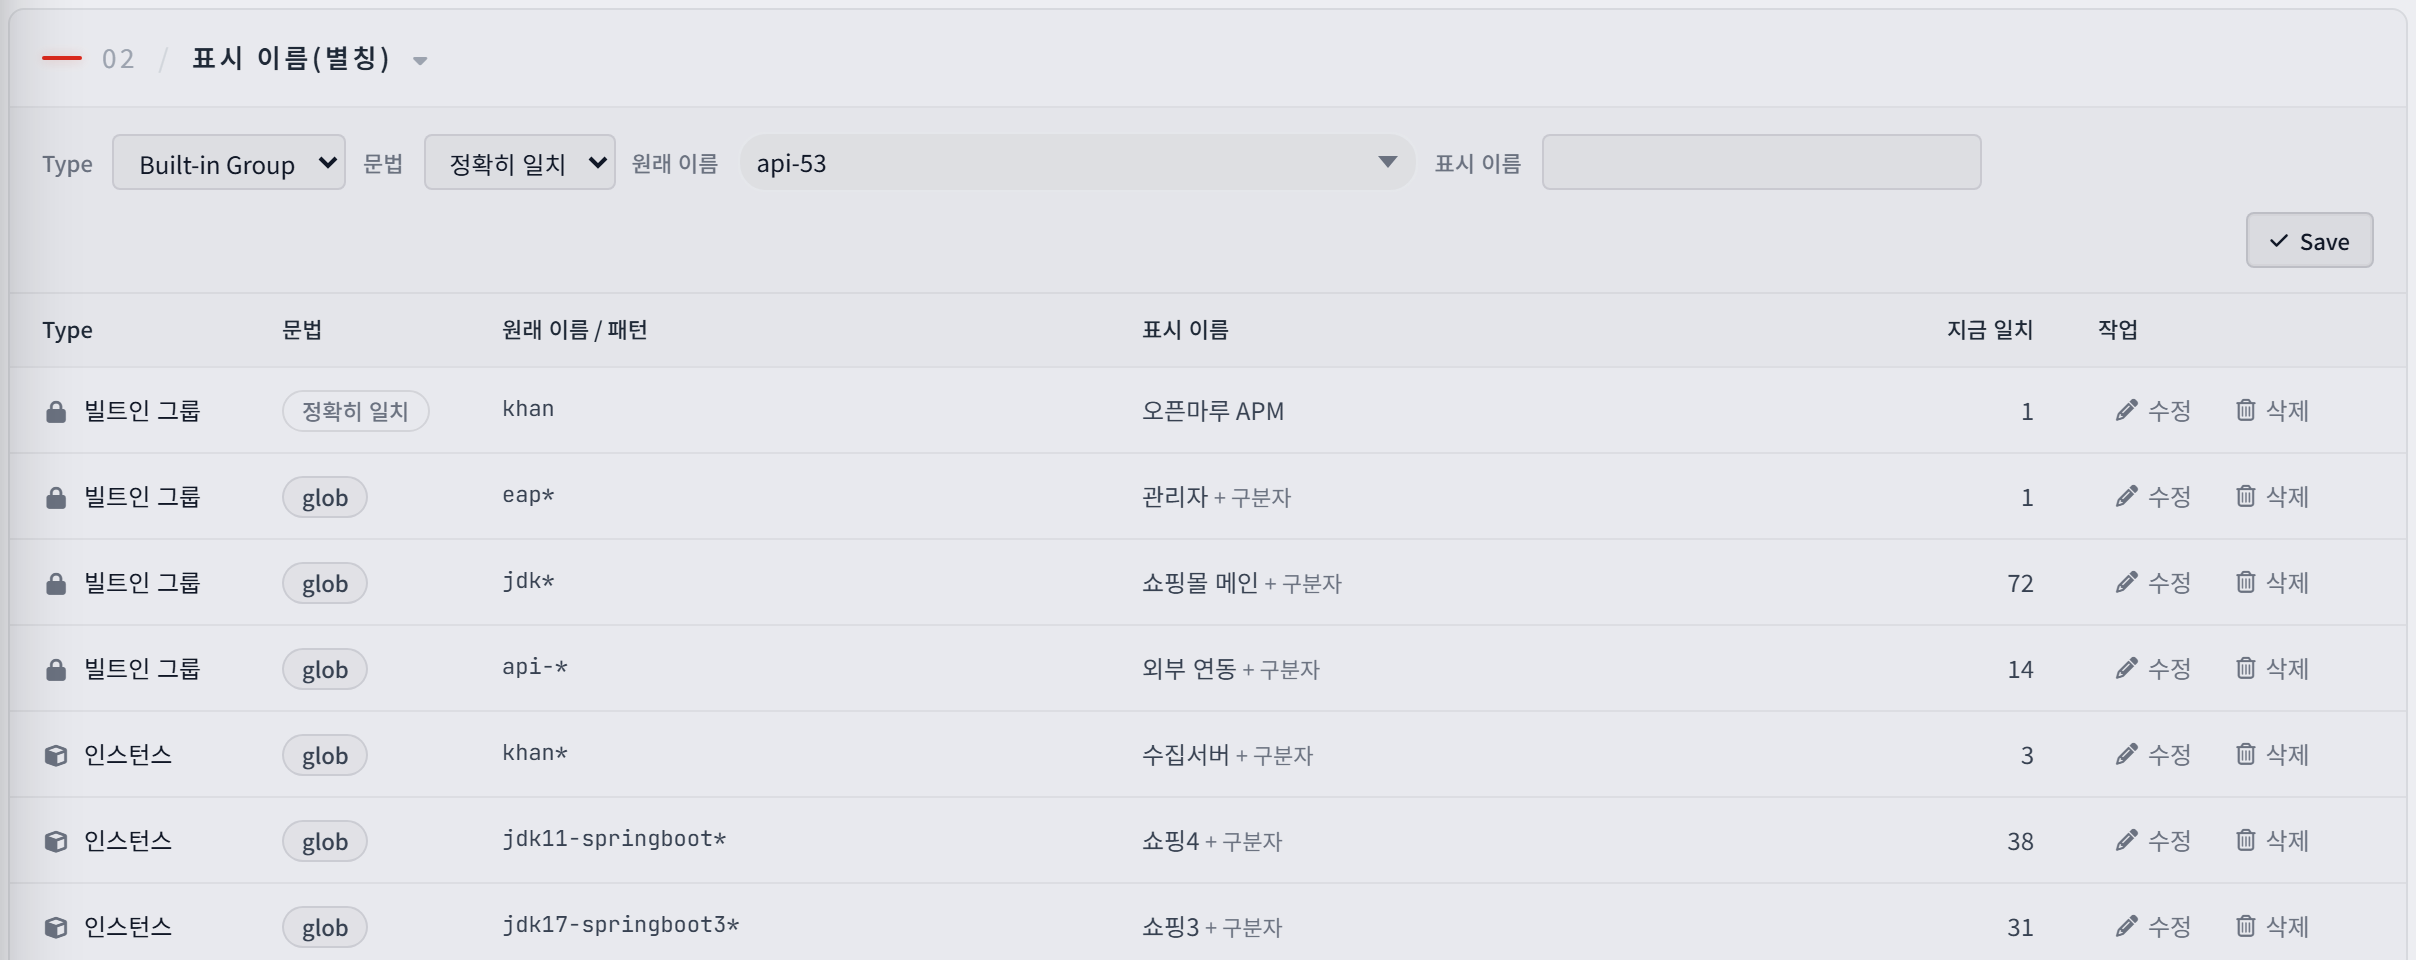
Display Names (Aliases) — Your Own Names Instead of the Originals
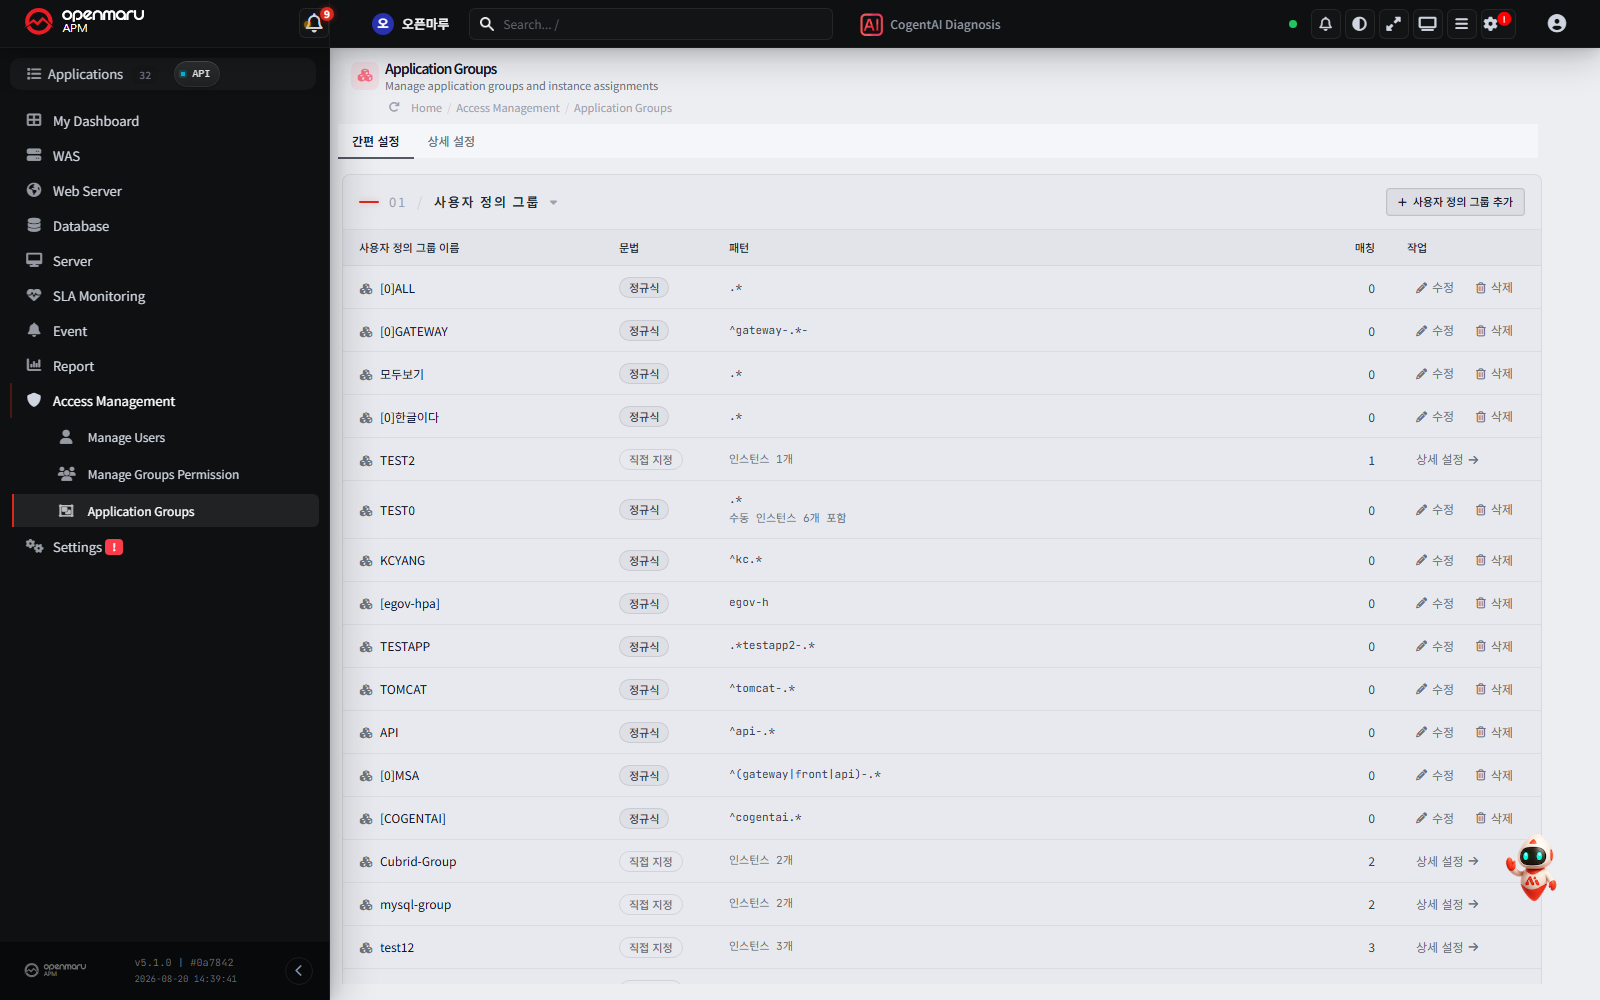
Added a new Quick Settings tab to application groups. Define a naming rule (pattern) here, and consistent display names are applied automatically even in environments like Kubernetes where names change with every deployment
Display names appear instead of the original names on nearly every screen — event lists, charts, the topology map, CogentAI, reports, Excel downloads, and WAS statistics
Section titles in the Quick Settings tab can be clicked to collapse and expand, so groups stay easy to find even when there are many. The collapsed state is kept the next time you visit
You can jump straight to a tab via the URL, and switching to "Detailed Settings" automatically selects the group you were viewing
Location: Access Management → Application Groups → Quick Settings tab
WAS Dashboard Request Velocity — Application Group Bands
Application groups are shown as bands above the traffic trend graph, so you can see at a glance which group's traffic concentrated in which time window
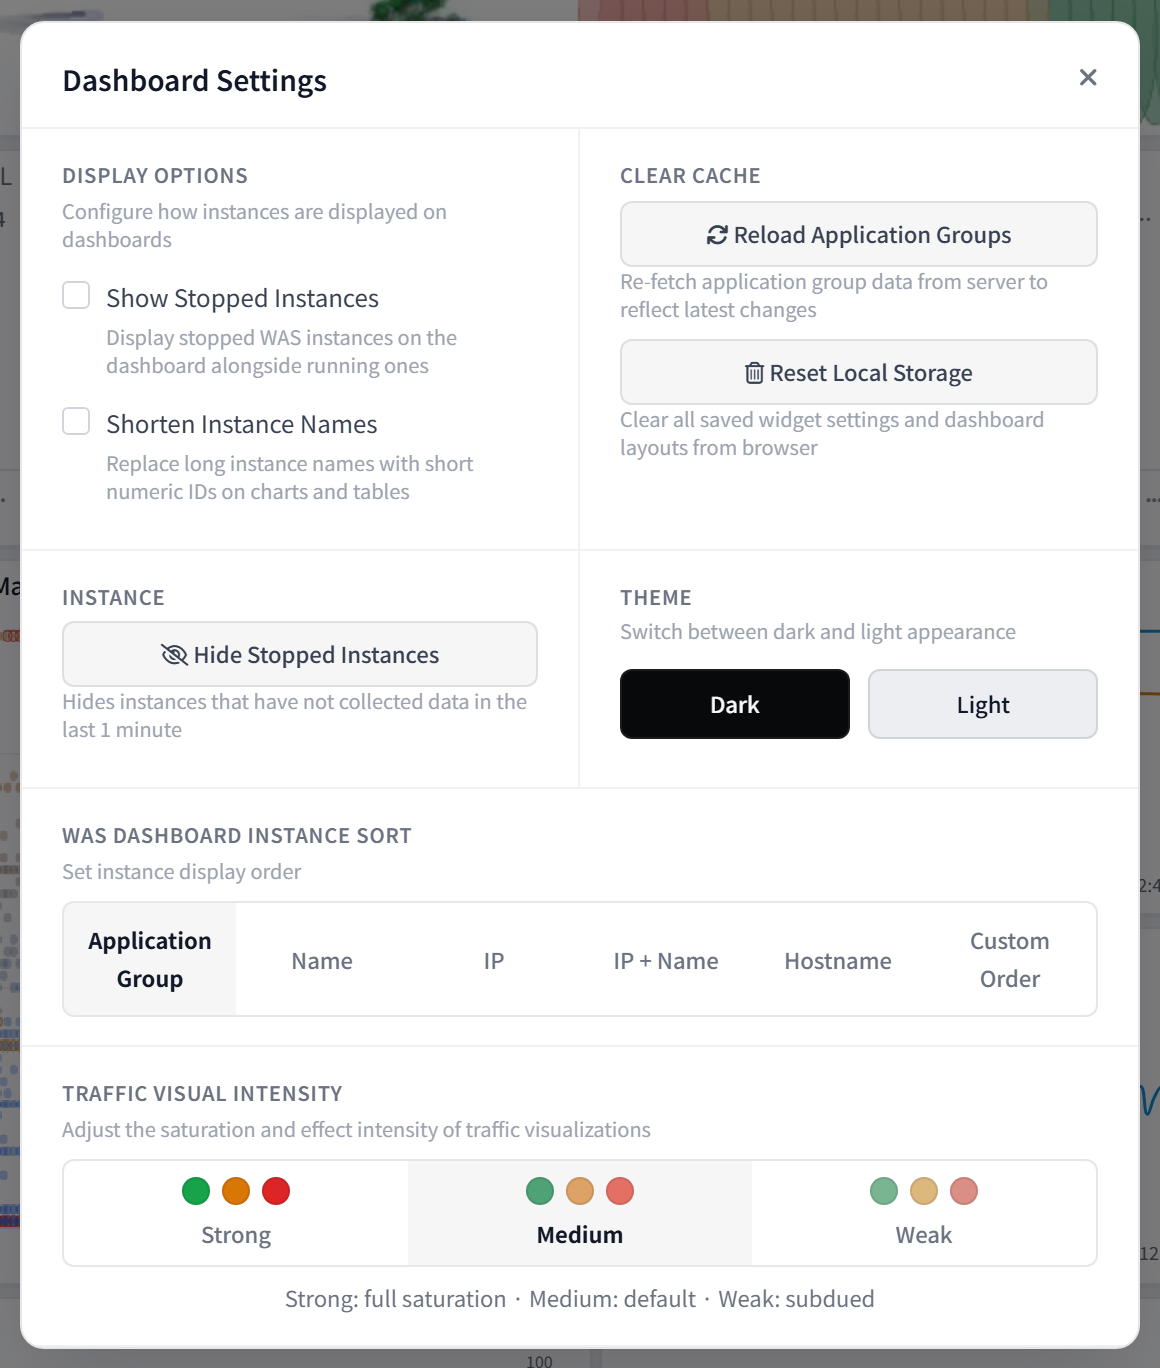
Applies once WAS dashboard instance sorting is set to "Application Group" under the gear icon in the top header → Preferences
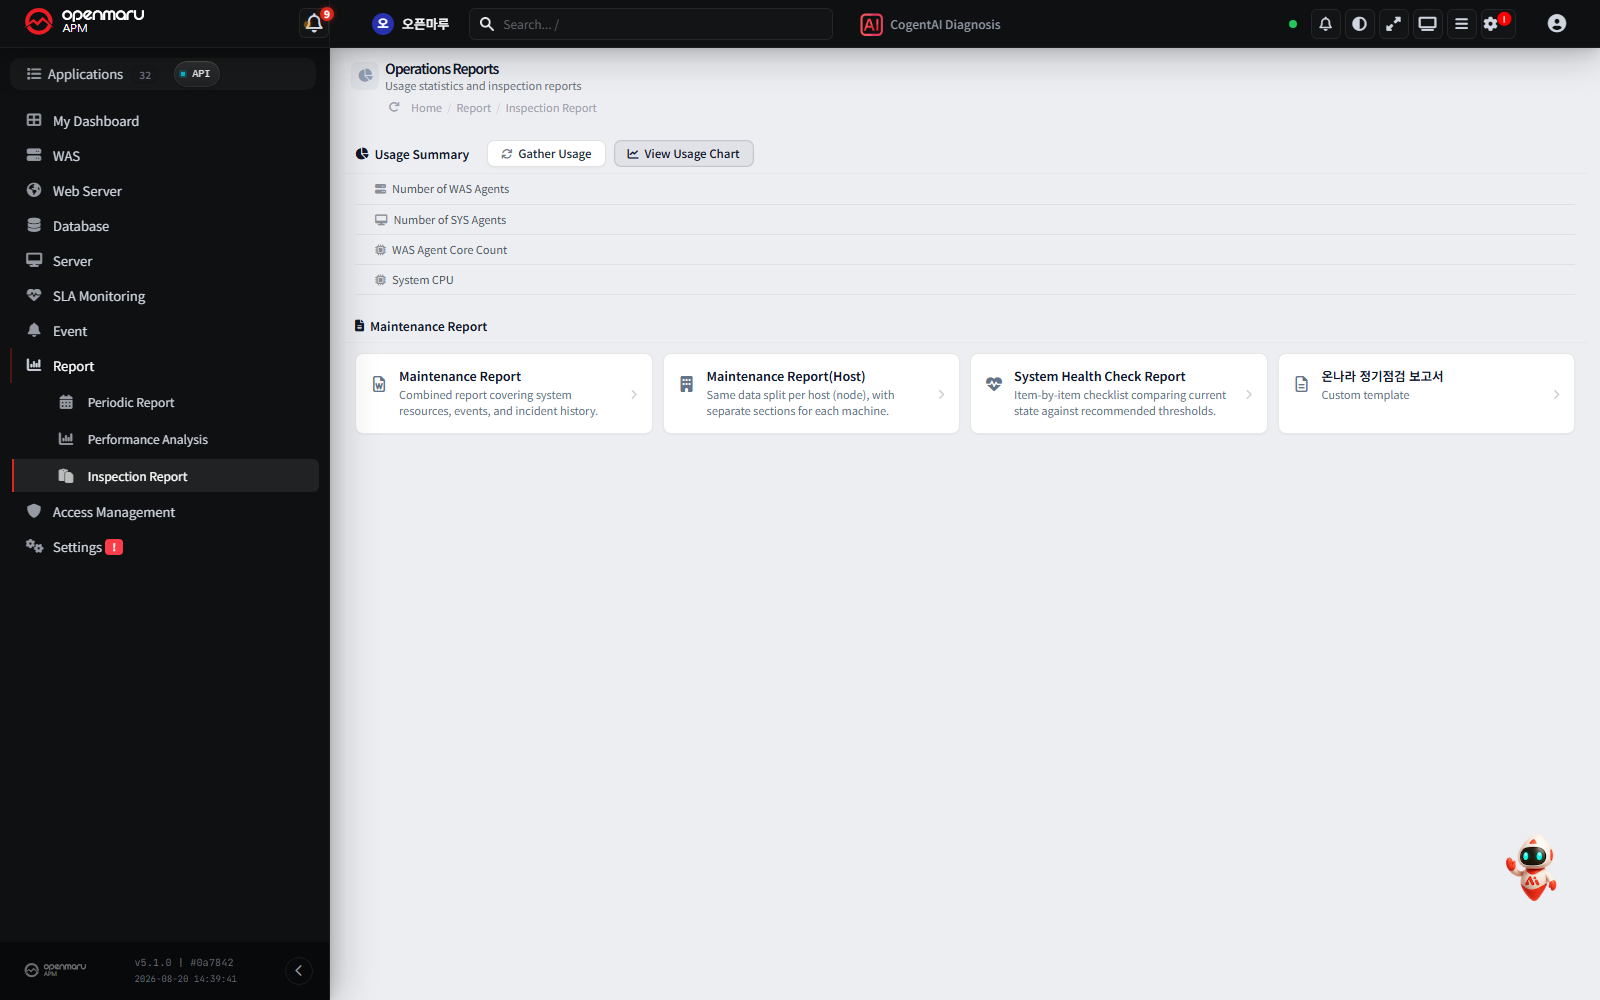
Added an option to exclude container (Pod) items in Kubernetes environments — values read from inside a container are actually node values, so they could not be used as inspection results
Reorganized OS items into sections by role
Reports can now be downloaded in JSON and Markdown formats in addition to DOCX
Fixed an issue where the password was exposed as-is during login
Fixed a vulnerability during login and authentication (OIDC) where the post-login redirect address could be altered arbitrarily, along with a vulnerability where that value could be exposed directly on screen
Fixed an issue where certain accounts failed authentication when logging in with an API access key
Added a check so that real-time data for groups the user has no permission for is not subscribed to on the dashboard
Fixed an issue where the CogentAI widget emitted a temporary value instead of the authentication token, causing authentication to fail in Kubernetes environments